

Add Upcoming TIROxMDS Seminars to Your Calendar
In 2 quick steps, you can add our entire schedule of upcoming seminars to your calendar today! Then you will get notified of upcoming lectures, presentations and case-based studies. Every Friday at 8:00 AM EST, we cover a new topic from published research.
Add to Calendar


Care Recommendations
The recommendations in TIRO are based on the published recommendations for thyroid nodule and for thyroid cancer management. They are not intended to be “new guidelines.” Instead, TIRO is an amalgamation of published recommendations born out of the rigorous process of developing guidelines by a variety of international organizations. By highlighting the commonalities and the discrepancies, we aim to direct the clinician as to the optimal standards of care that currently exist.
Tables & Figures
Click on a topic to reveal the tables and figures within that section.
Differentiated Thyroid Cancer
Initial Evaluation of Thyroid Nodules
Tables & Figures
Table 4. Familial & Heritable Forms of Thyroid Cancer
Familial Adenomatosis Polyposis
| Gene | APC |
| Benign Thyroid Disease | 40% |
| Cancer | 0.4–12% |
| Cancer Types | CMV-PTC: 63% FV-PTC: 25% PTC: 12% |
PTEN-Hamartoma Tumor (Cowden)
| Gene | PTEN |
| Benign Thyroid Disease | 75% |
| Cancer | 35% |
| Cancer Types | PTC: 50% FV-PTC: 28% FTC: 14% |
Carney Complex Type 1
| Gene | PRKARIA |
| Benign Thyroid Disease | ≤ 75% |
| Cancer | < 5% |
| Cancer Types | PTC FTC |
RET-Associated
| Gene | RET |
| Benign Thyroid Disease | — |
| Cancer | 100% |
| Cancer Types | MTC |
DICER1
| Gene | DICER1 |
| Benign Thyroid Disease | ≤ 30% |
| Cancer | — |
| Cancer Types | FTC FV-PTC |
CMV = Cribiform Morular Variant; FV = Follicular Variant
Percentages refer to disease prevalence.
Bethesda System
Bethesda Category I
| Meaning | Non Diagnostic |
| Estimated Risk of Malignancy | 5–10% |
Bethesda Category II
| Meaning | Benign |
| Estimated Risk of Malignancy | 0–3% |
Bethesda Category III
| Meaning | Atypia of Undetermined Significance (AUS) / Follicular Lesion of Undetermined Significance (FLUS) |
| Estimated Risk of Malignancy | 10–30% |
Bethesda Category IV
| Meaning | Suspicious for a Follicular (or Hürthle Cell) Neoplasm |
| Estimated Risk of Malignancy | 25–40% |
Bethesda Category V
| Meaning | Suspicious for Malignancy |
| Estimated Risk of Malignancy | 50–75% |
Bethesda Category VI
| Meaning | Malignant |
| Estimated Risk of Malignancy | 97–99% |
As reported in The Bethesda System by Cibas and Ali (DOI 10.1007/978-3-319-60570-8).
Figure 1. ATA Pattern-Based Ultrasound Findings vs TIRADS Point-based System
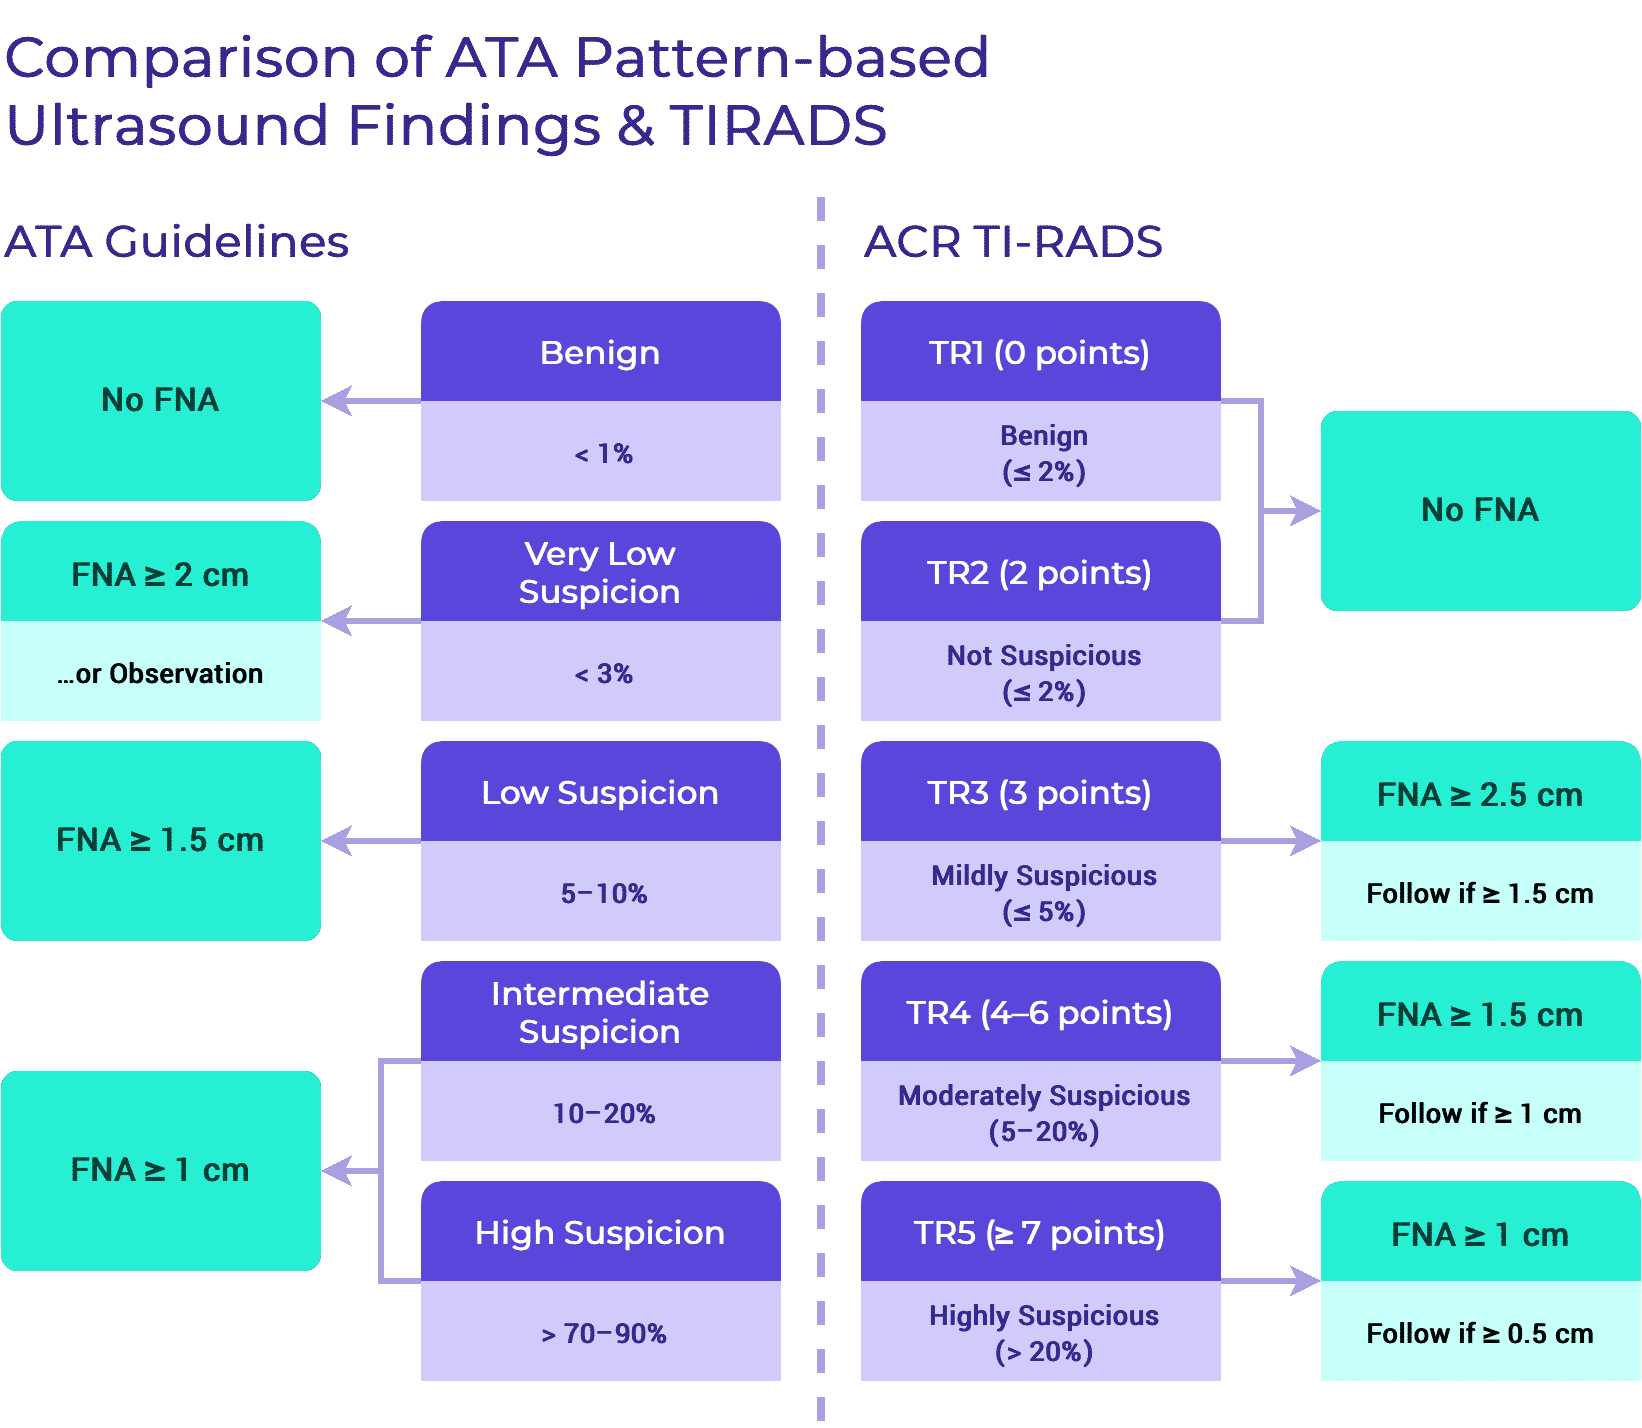
Adapted from the AAES.
Figure 2. ACR TI-RADS Classification of Thyroid Nodules
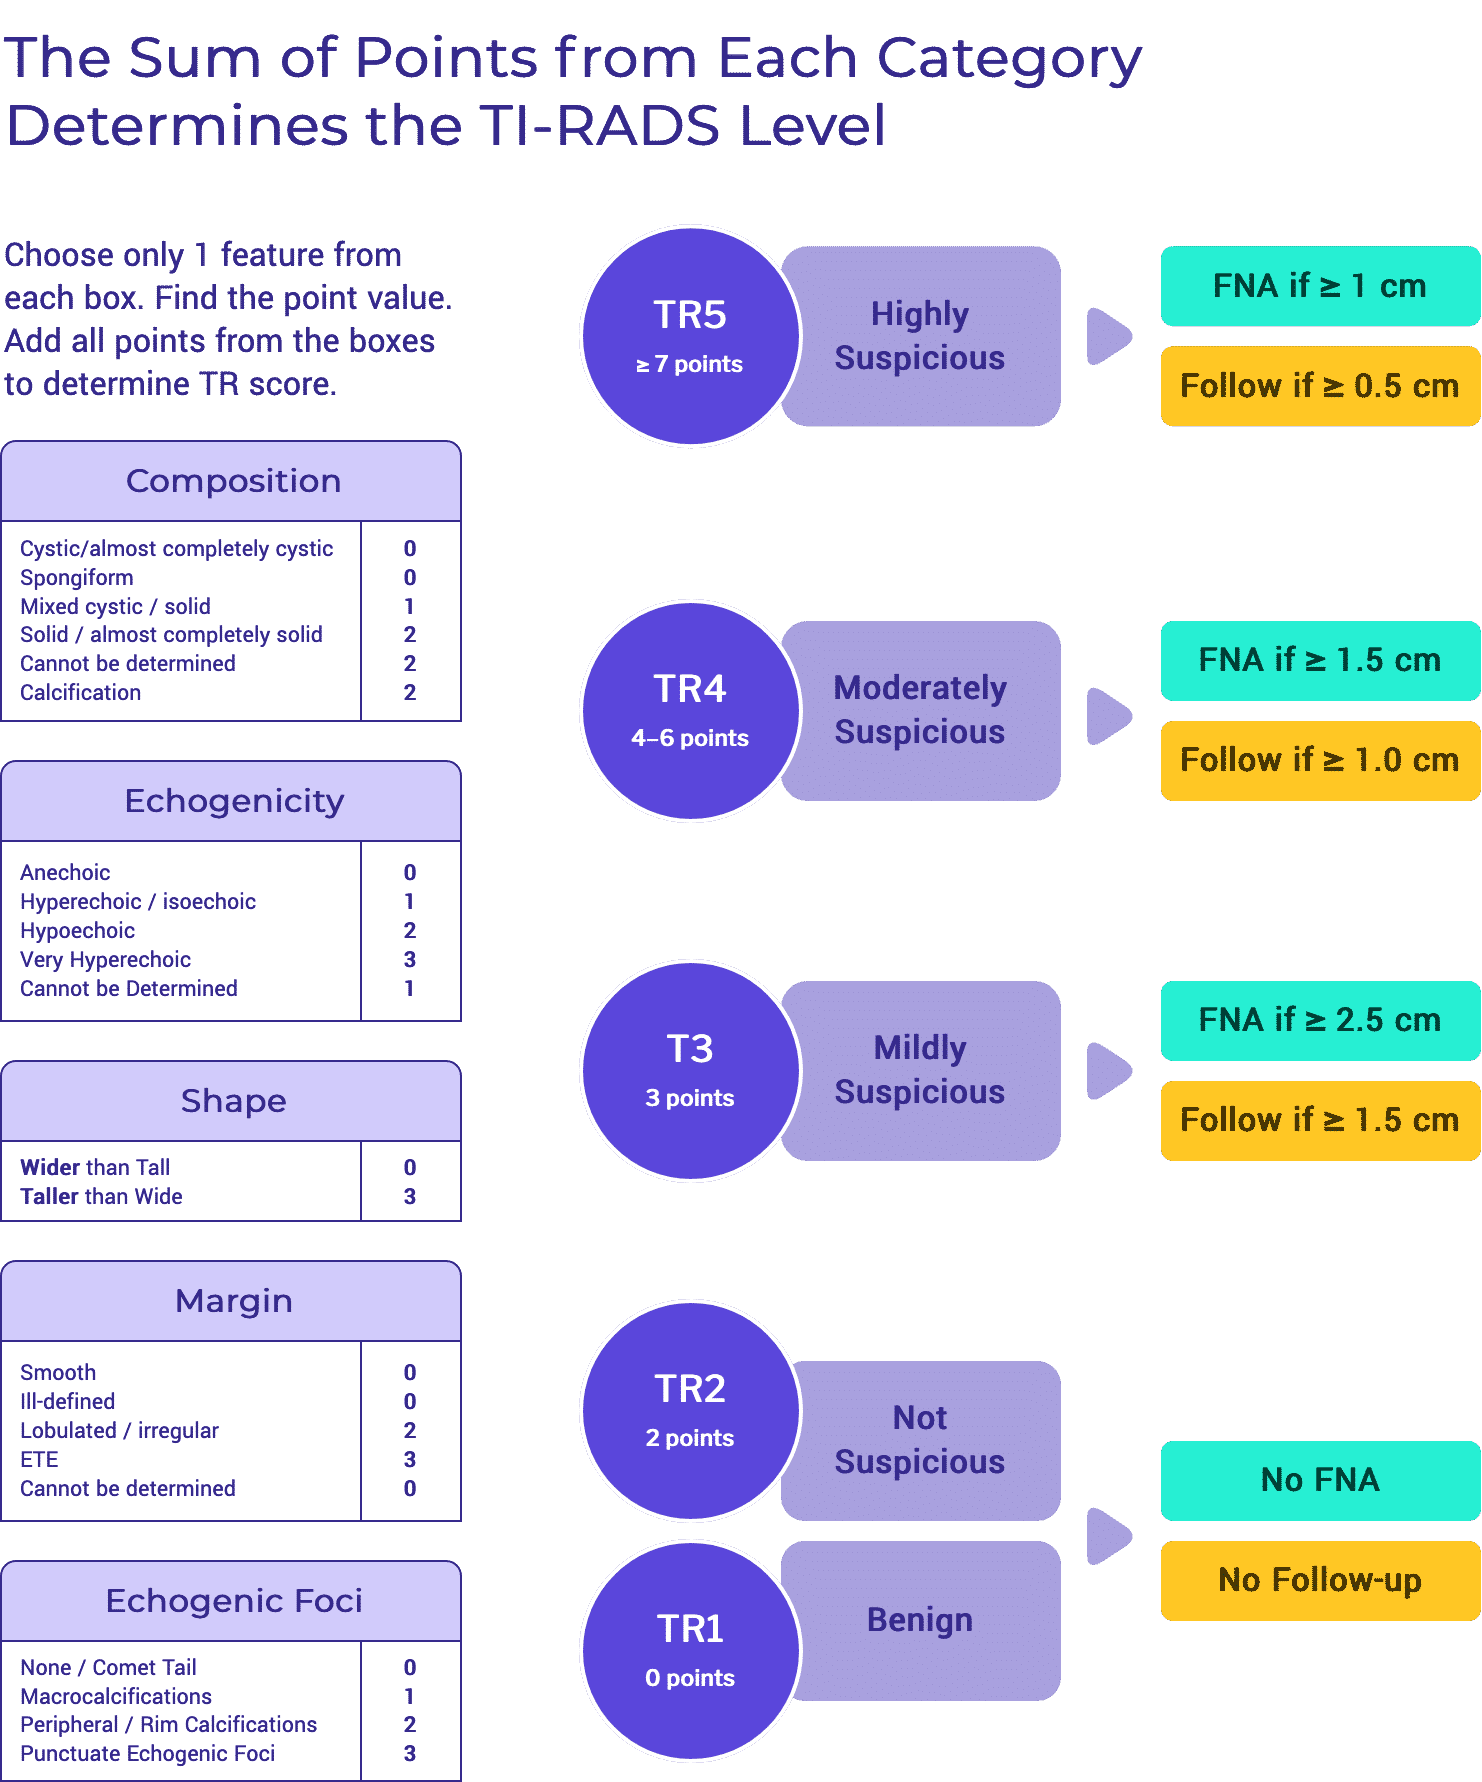
Adapted from the ACR TI-RADS.
Initial Management
Tables & Figures
Figure 4. Levels of the Neck for Lymph Node Classification
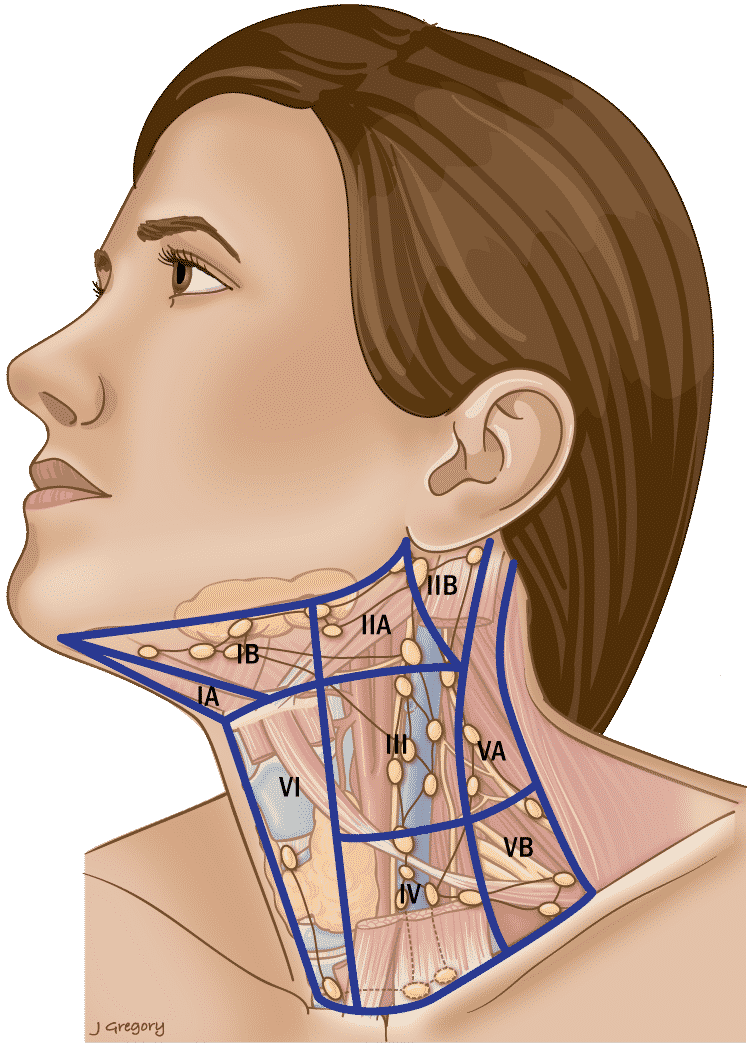
Table 3. Anatomic Boundaries of the Neck Levels
Level I
| Anterior |
| Anterior belly of the contralateral digastric muscle. |
| Posterior |
| Stylohyoid muscle |
| Superior |
| Body of the mandible |
| Inferior |
| Hyoid |
Triangular boundaries comprising anterior bellies of digastric muscles and hyoid separates IA & IB.
Level II
| Anterior |
| Stylohyoid muscle |
| Posterior |
| Posterior SCM |
| Superior |
| Skull base |
| Inferior |
| Hyoid |
CN XI separates IIA & IIB. IIA nodes lie anterior to IJV.
Level III
| Anterior |
| Sternohyoid muscle |
| Posterior |
| Stylohyoid muscle |
| Superior |
| Hyoid |
| Inferior |
| Horizontal plane defined by the cricoid cartilage. |
Level IV
| Anterior |
| Sternohyoid muscle |
| Posterior |
| Posterior SCM |
| Superior |
| Inferior border of the cricoid cartilage. |
| Inferior |
| Clavicle |
Level V
| Anterior |
| Posterior SCM |
| Posterior |
| Anterior border of trapezius. |
| Superior |
| Convergence of the SCM and trapezius. |
| Inferior |
| Clavicle |
Inferior border of cricoid separates VA & VB.
Level VI
| Anterior |
| Anterior layer of the cervical fascia. |
| Posterior |
| Deep layer of the cervical fascia. |
| Superior |
| Hyoid superiorly |
| Inferior |
| Sternal notch |
Level VII
| Anterior |
| Sternum |
| Posterior |
| Deep layer of the cervical fascia. |
| Superior |
| Sternal notch |
| Inferior |
| Innominate on right and equivalent plane on the left. |
SCM = sternocleidomastoid muscle
Initial Staging & Response to Therapy
Initial Staging
Tables & Figures
Figure 10a. Definition of tumor size (T)
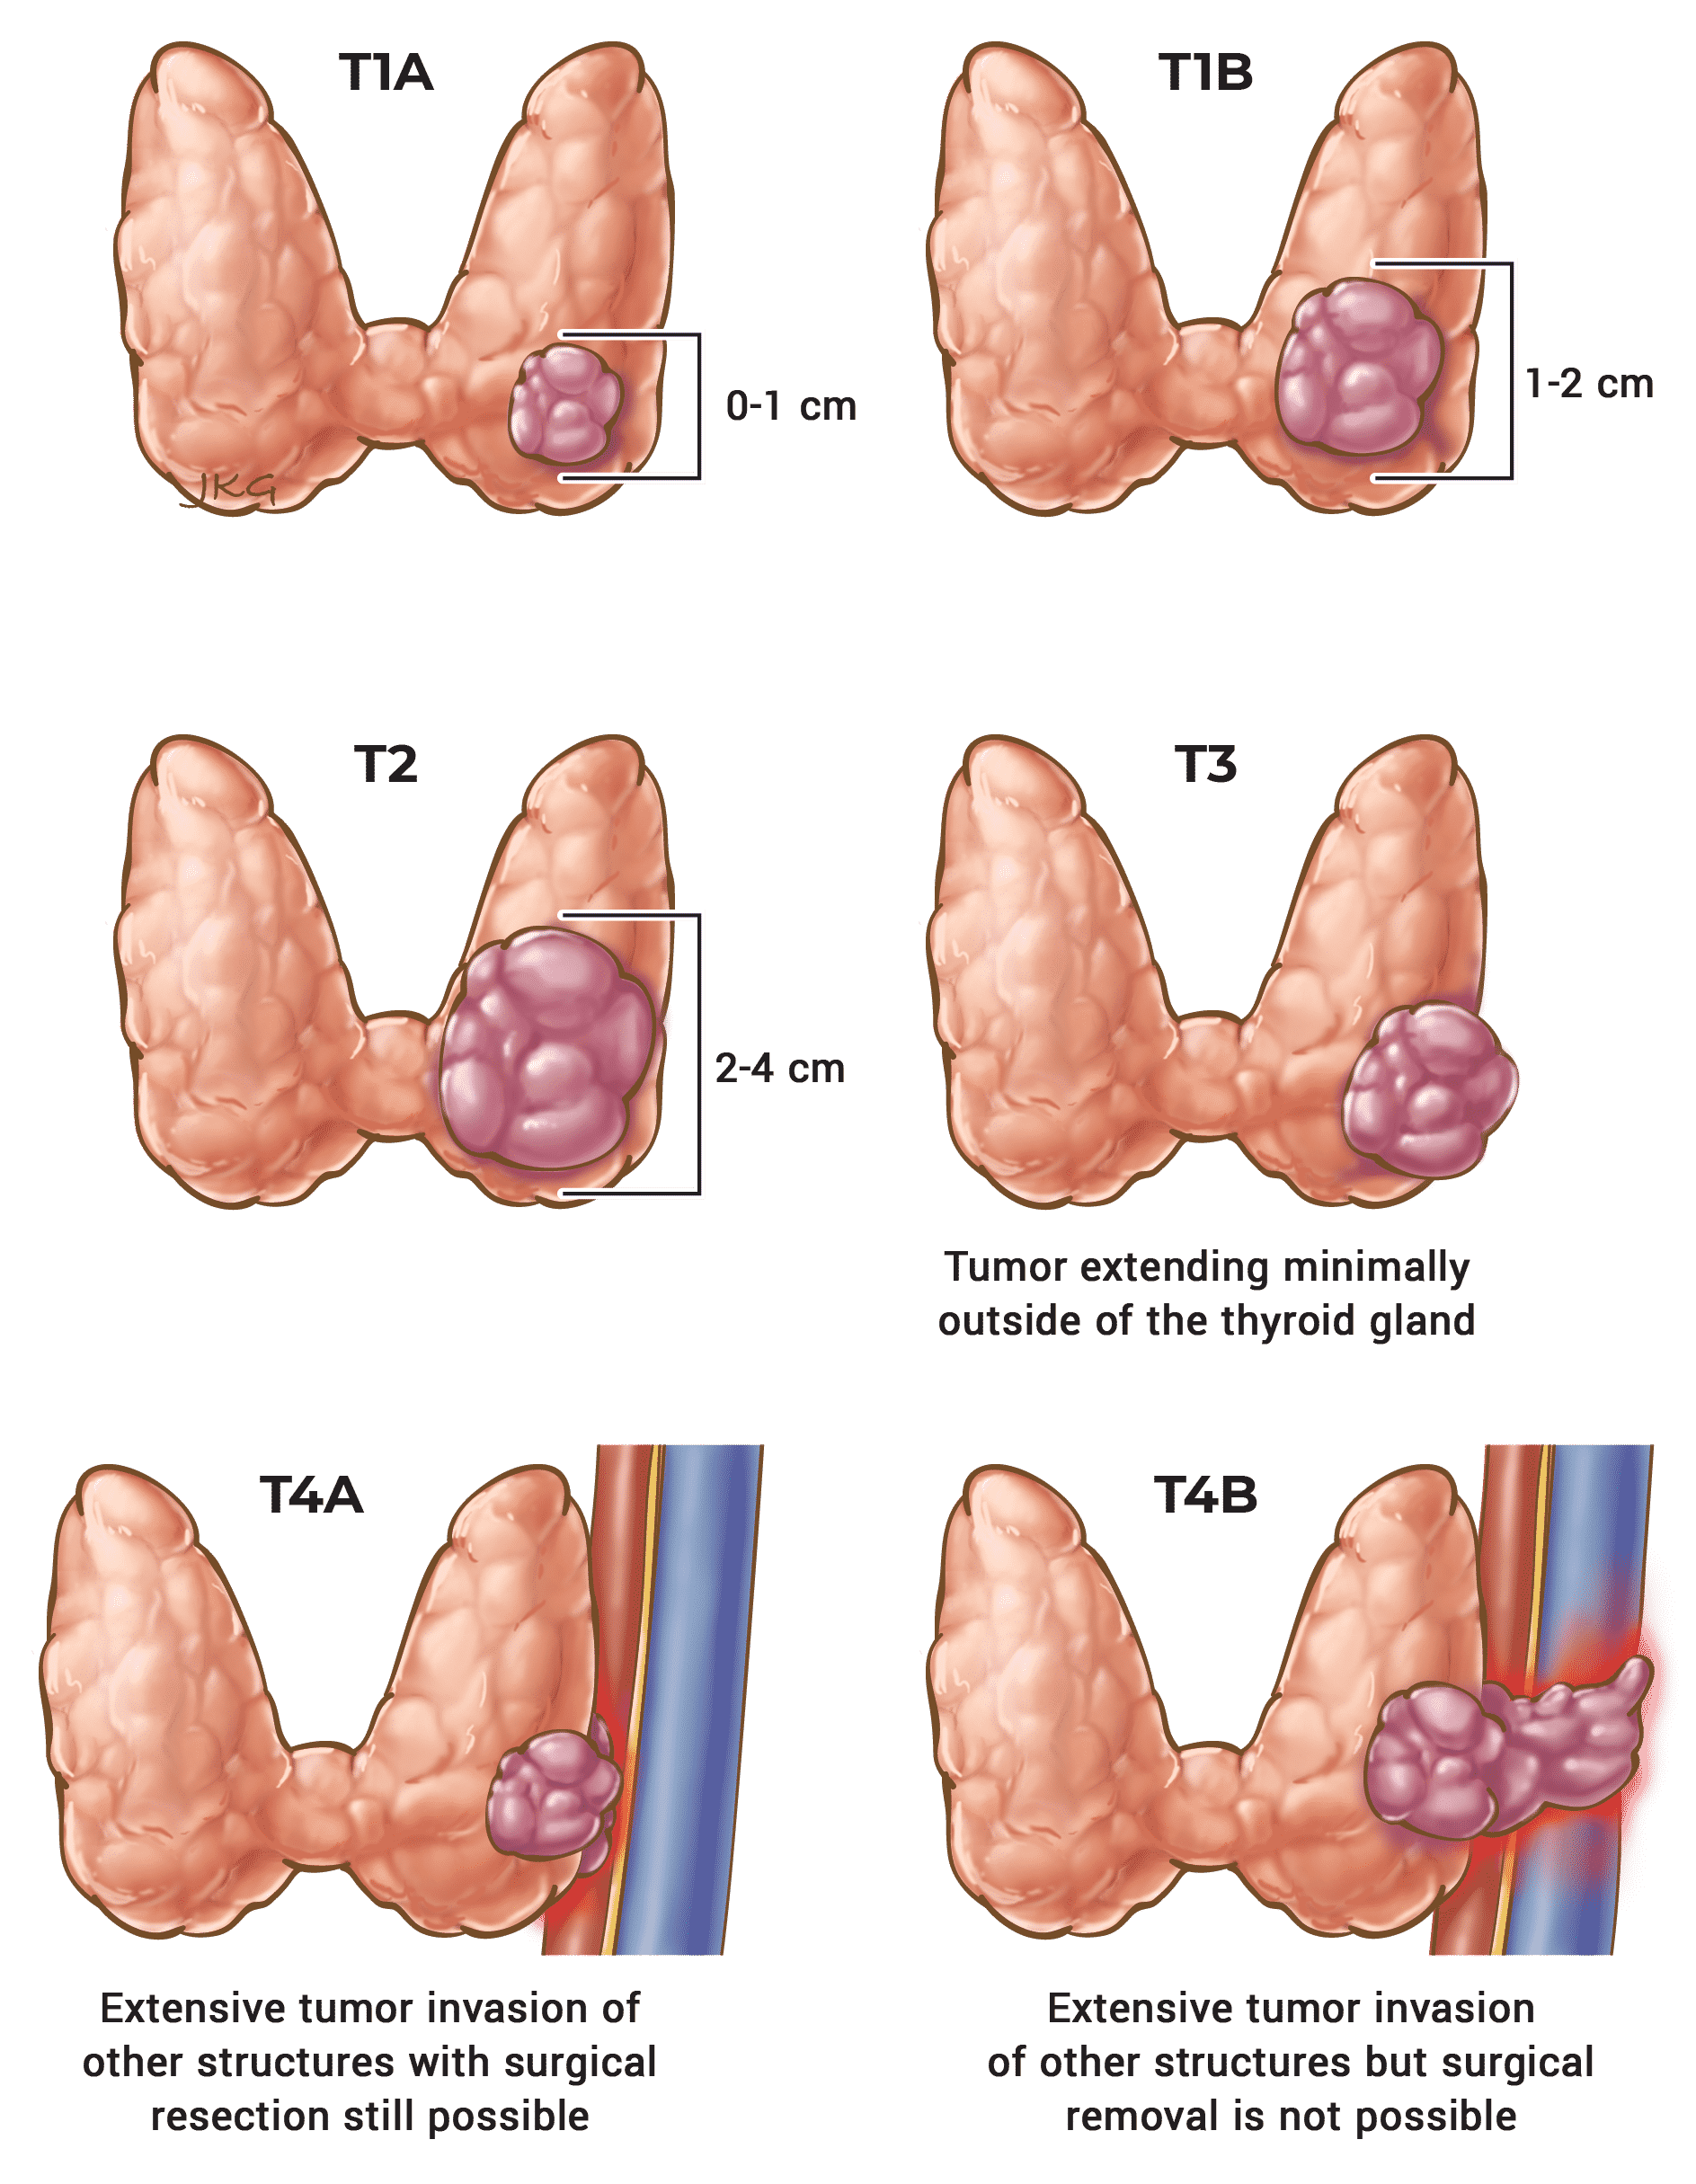
Figure 10b. Definition of regional lymph node (N)

Response to Therapy
Management Recommendations Based on Risk Stratification
Tables & Figures
Table 11. Risk Stratification System with Proposed Modifications (ATA 2009)
Risk Level
ATA Low Risk
- Papillary thyroid cancer (with all of the following):
- No local or distant metastases,
- All macroscopic tumor has been resected,
- No tumor invasion of loco-regional tissues or structures,
- The tumor does not have aggressive histology (e.g. tall cell, hobnail variant, columnar cell carcinoma),
- If I131 is given, there are no RAI-avid metastatic foci outside the thyroid bed on the first post-treatment whole-body RAI scan,
- No vascular invasion,
- Clinical N0 or ≤ 5 pathologic N1 micrometastases (< 0.2 cm in largest dimension).*
- Intrathyroidal, encapsulated follicular thyroid variant of papillary thyroid cancer.*
- Intrathyroidal, well-differentiated follicular thyroid cancer with capsular invasion and no or minimal (< 4 foci) vascular invasion.*
- Intrathyroidal, papillary microcarcinoma, unifocal or multifocal, including BRAFV600E mutated (if known).*
ATA Intermediate Risk
- Microscopic invasion of tumor into the perithyroidal soft tissues.
- RAI-avid metastatic foci in the neck on the first post-treatment whole-body RAI scan.
- Aggressive histology (e.g. tall cell, hobnail variant, columnar cell carcinoma).
- Papillary thyroid cancer with vascular invasion.
- Clinical N1 or > 5 pathologic N1 with all involved lymph nodes < 3 cm in largest dimension.*
- Multifocal papillary microcarcinoma with ETE and BRAFV600E mutated (if known).*
ATA High Risk
- Macroscopic invasion of tumor into the perithyroidal soft tissues (gross ETE).
- Incomplete tumor resection.
- Distant metastases.
- Postoperative serum thyroglobulin suggestive of distant metastases.
- Pathologic N1 with any metastatic lymph node ≥ 3 cm in largest dimension.*
- Follicular thyroid cancer with extensive vascular invasion (> 4 foci of vascular invasion).*
Figure 11. ATA Spectrum of Risk of Recurrence
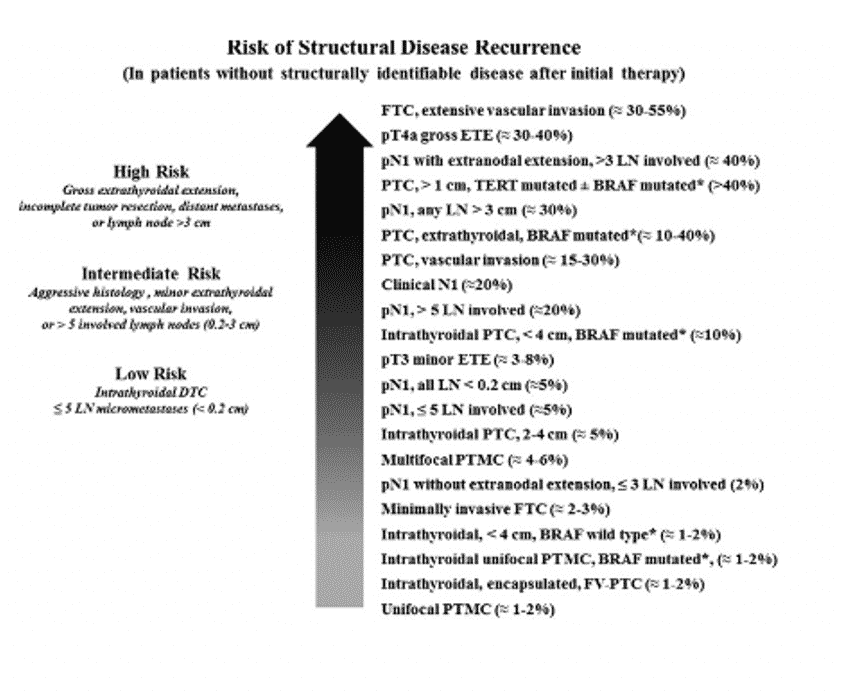
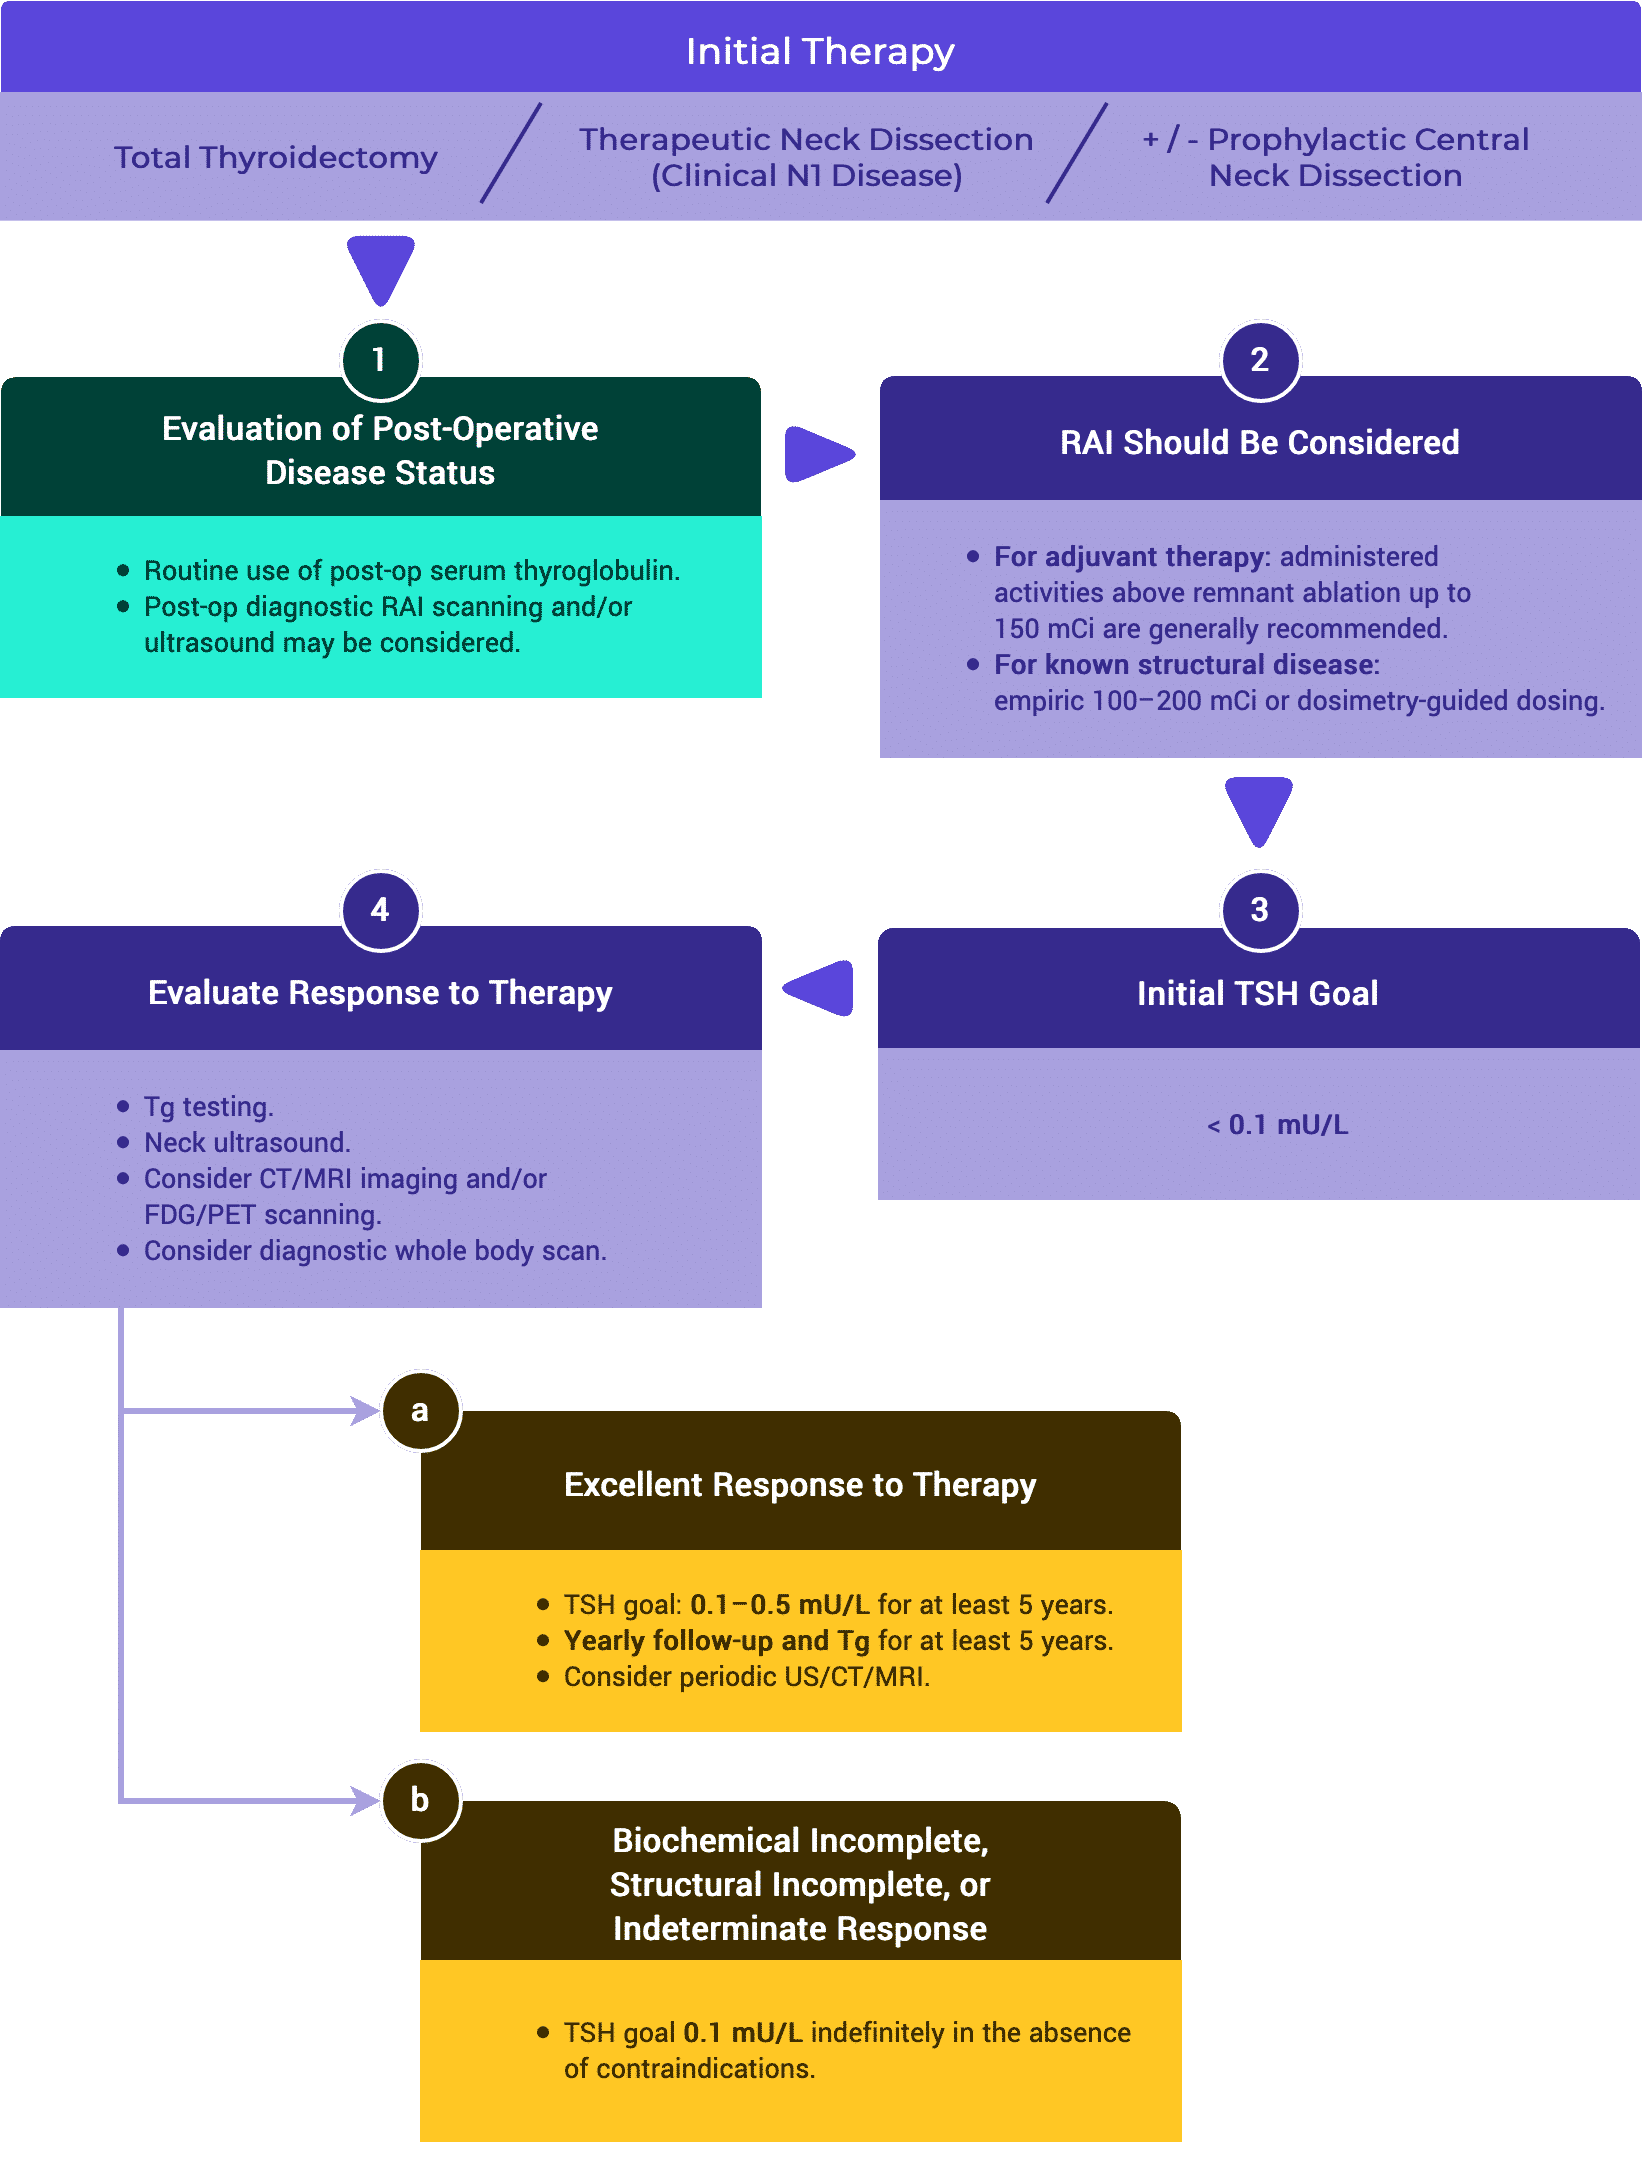
Figure 5. management recommendations in ATA low risk DTC patients who have undergone total thyroidectomy
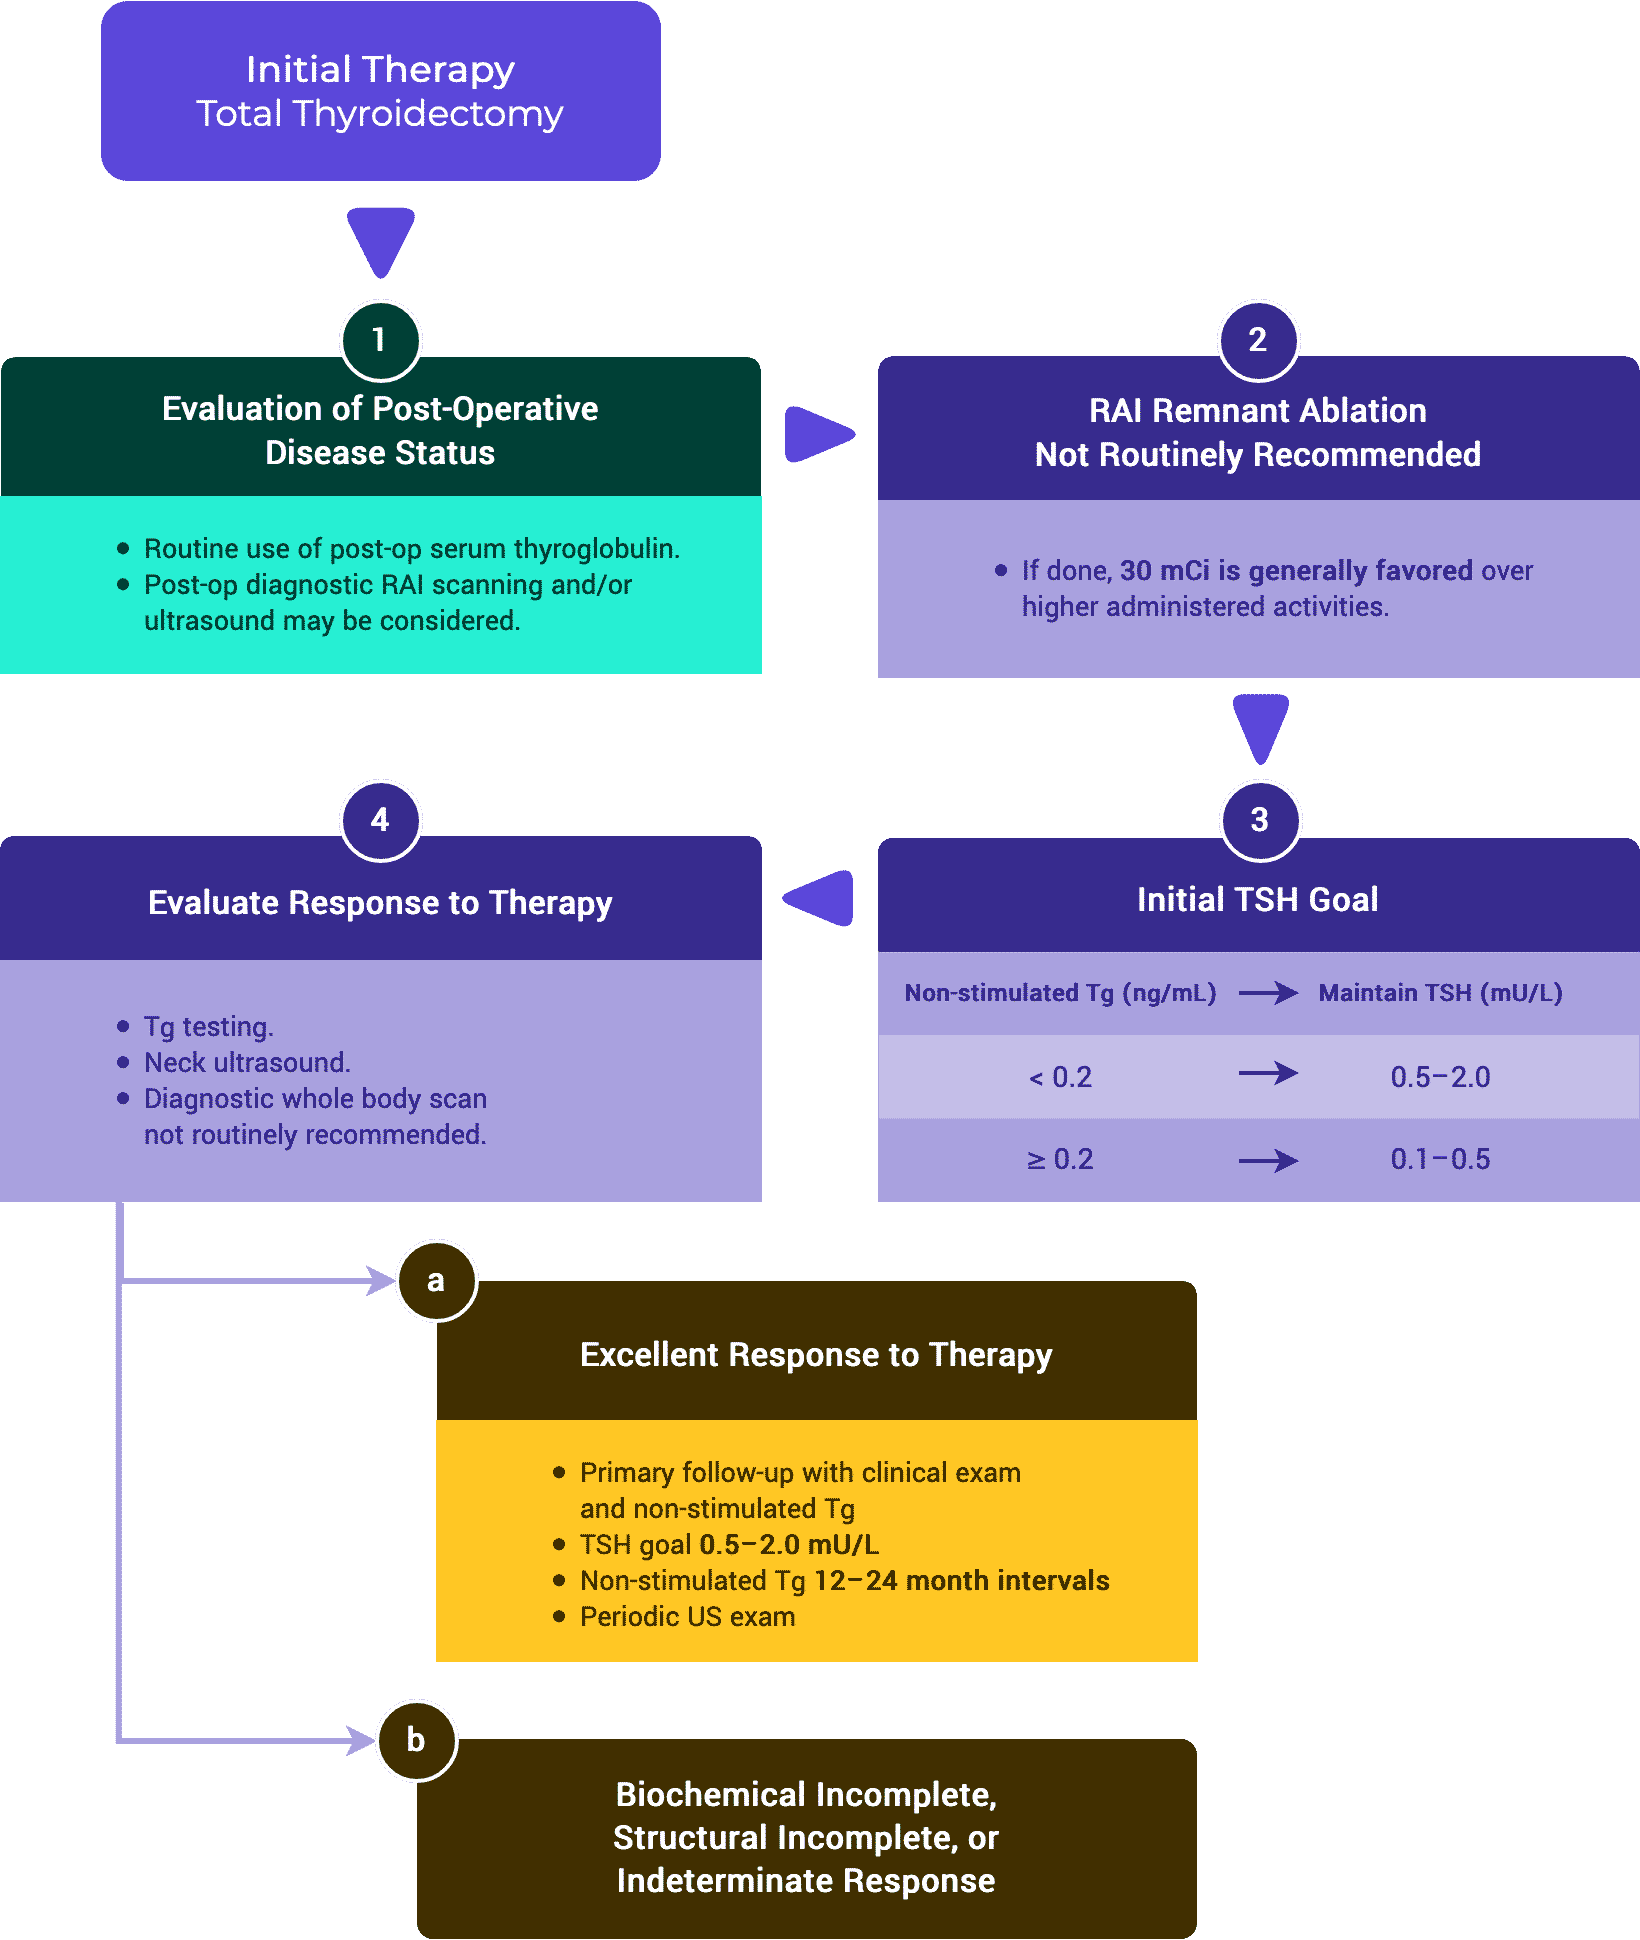
Adapted from the ATA.
Figure 6. management recommendations in ATA low risk DTC patients who have undergone less than total thyroidectomy
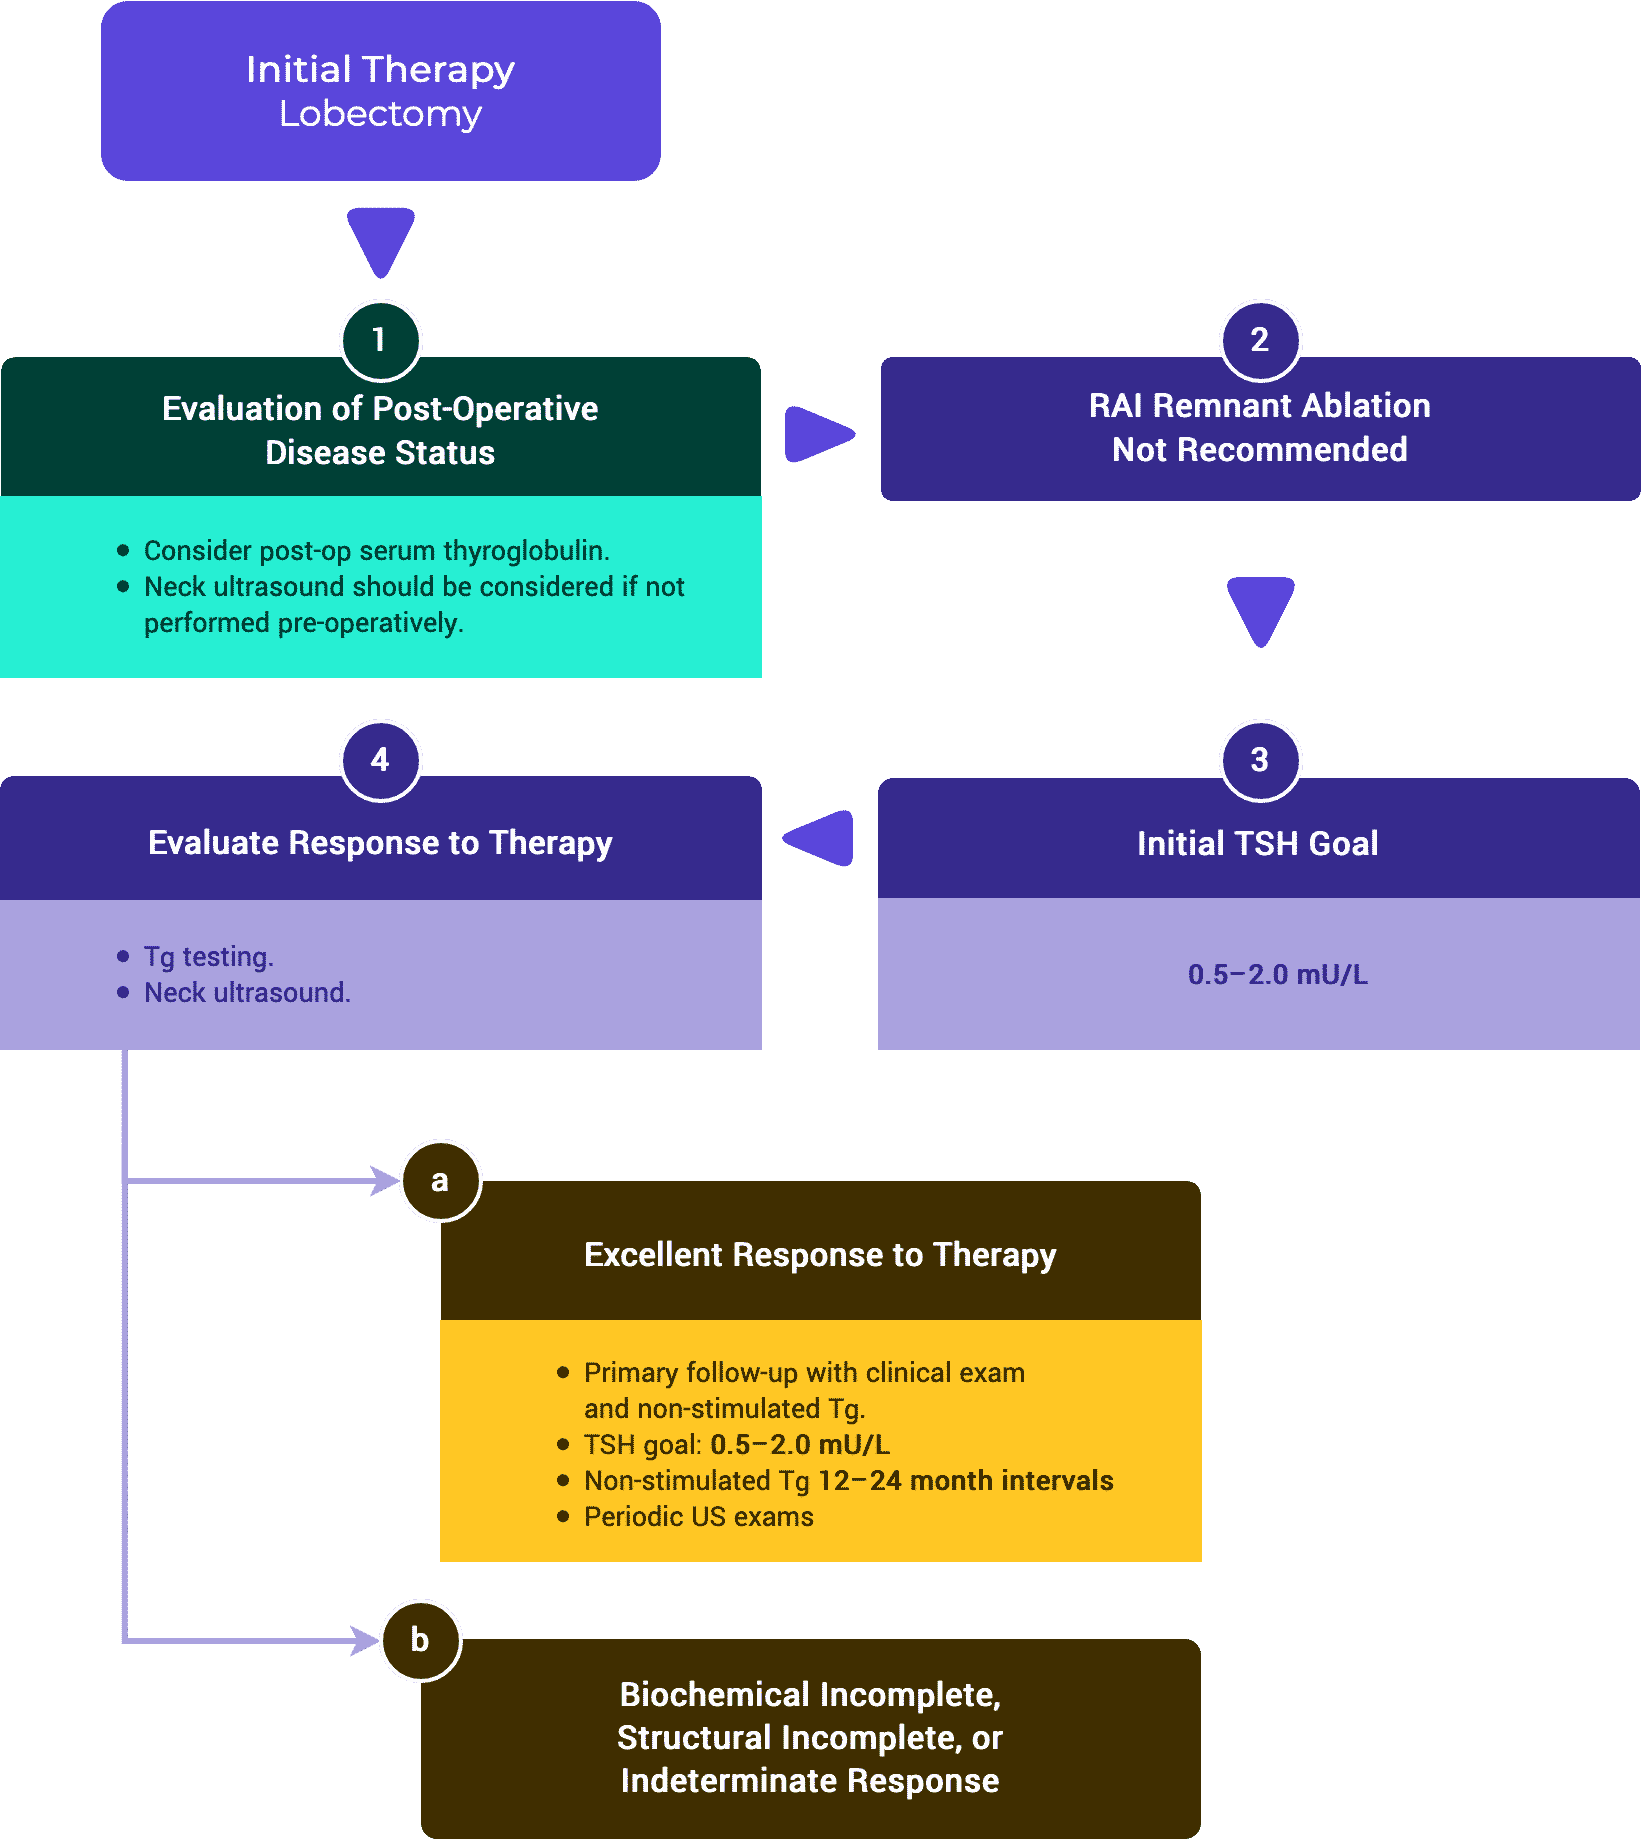
Adapted from the ATA.
Figure 7. management recommendations in ATA intermediate risk DTC patients who have undergone total thyroidectomy
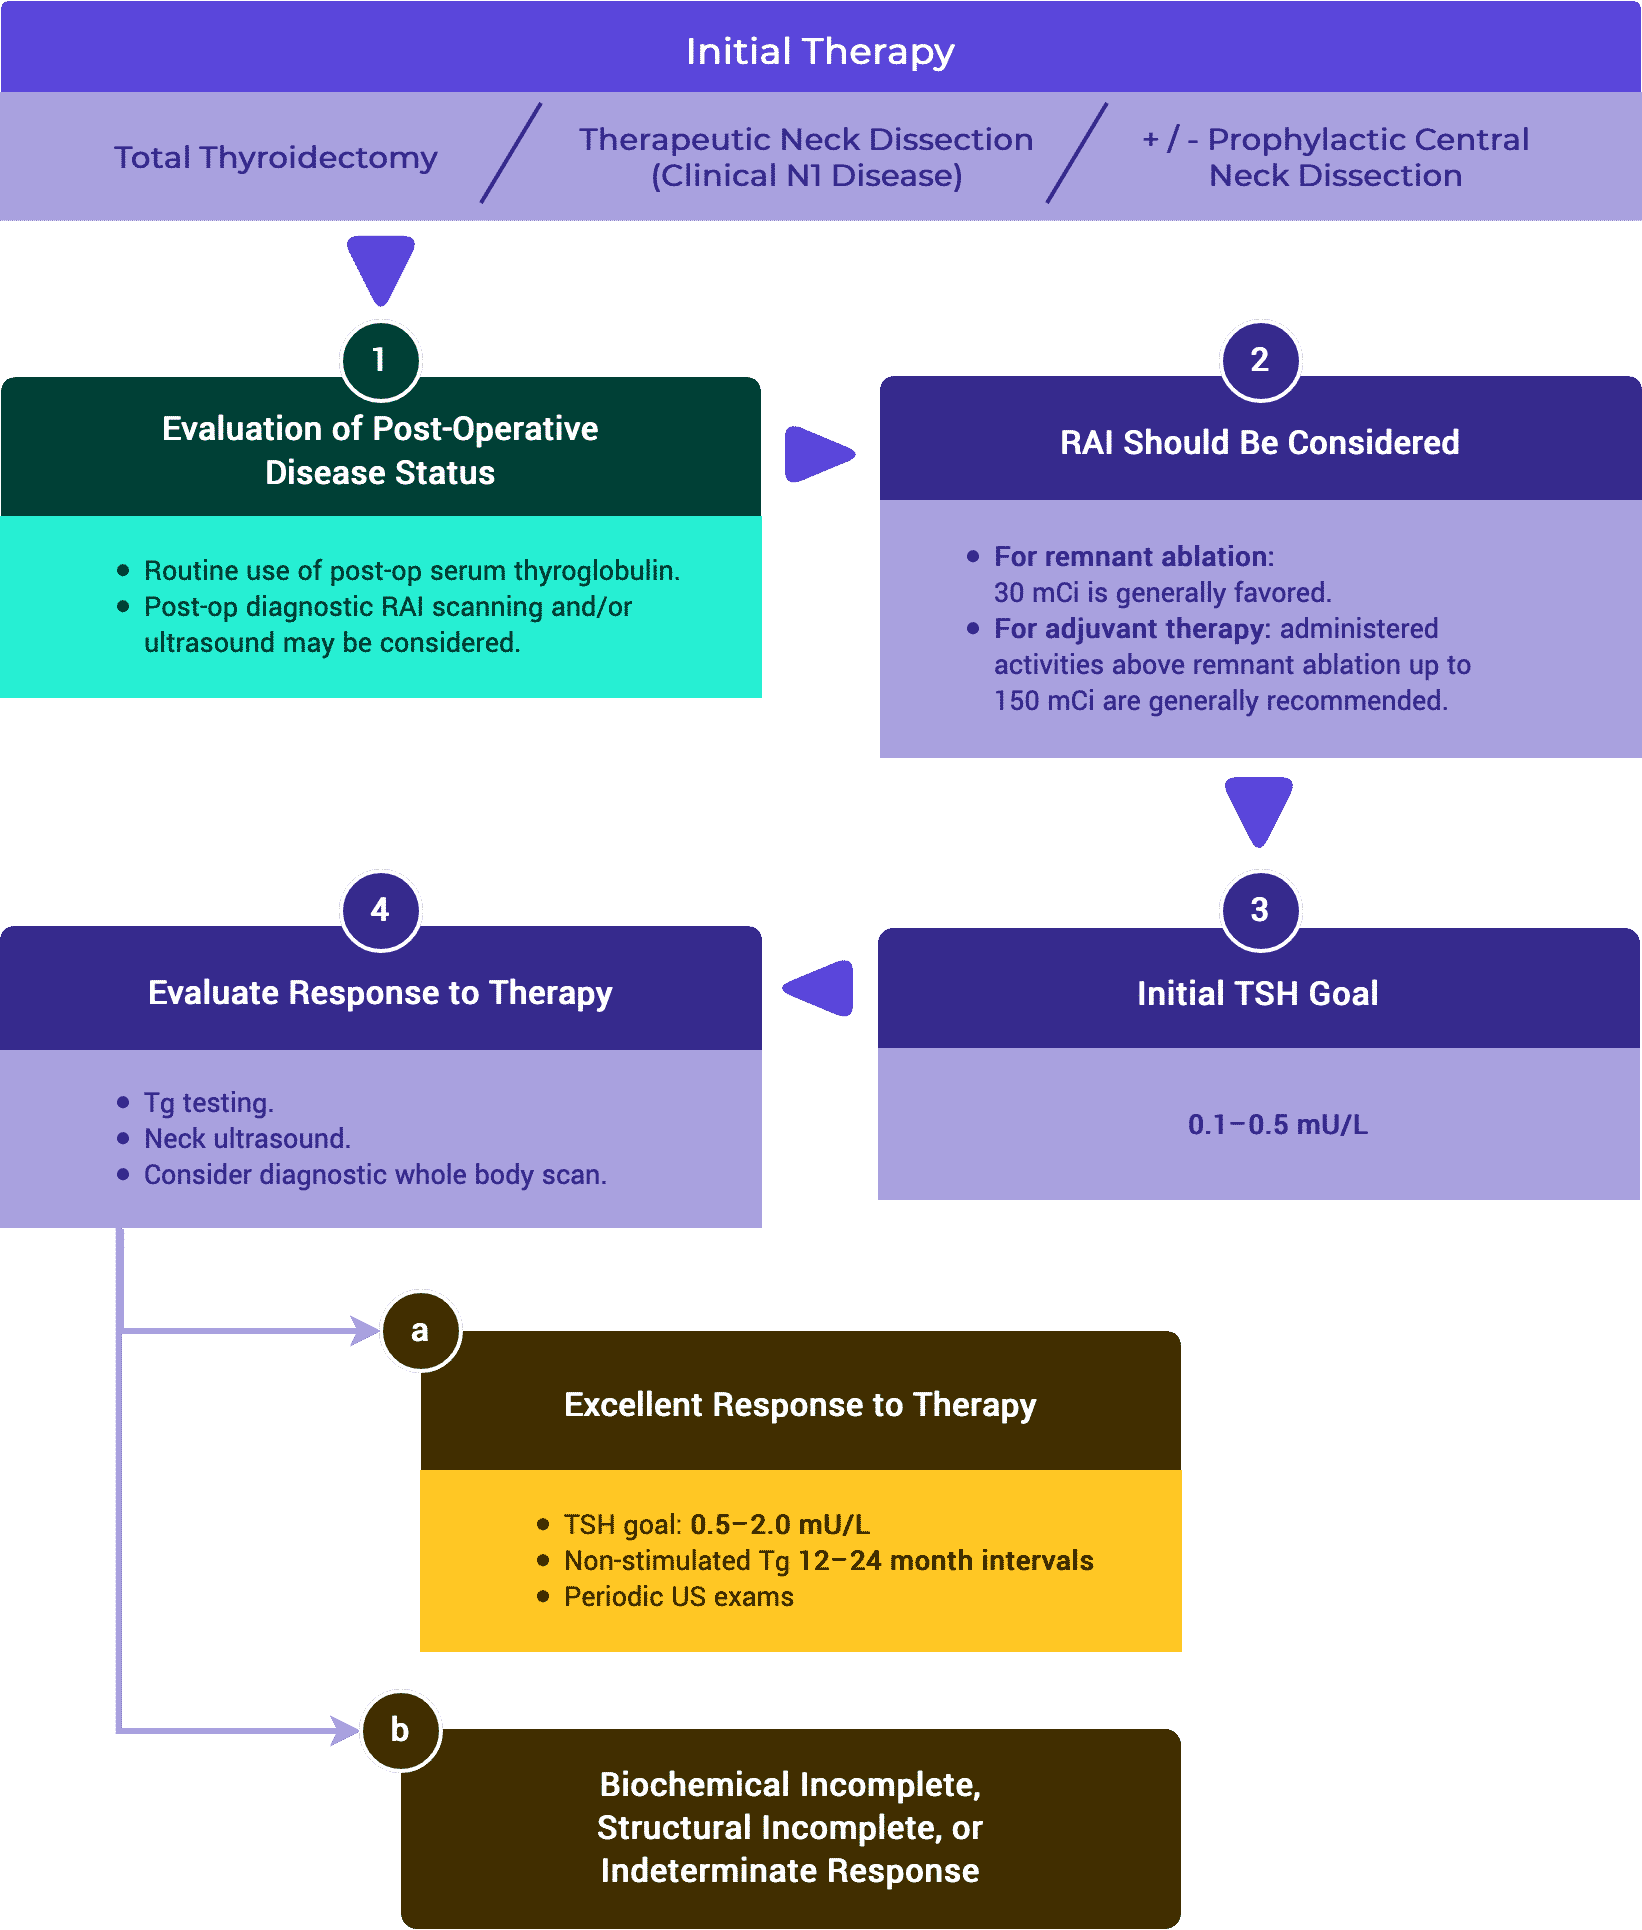
Adapted from the ATA.
Figure 8. management recommendations in ATA high risk DTC patients who have undergone total thyroidectomy and have no gross residual disease
Adapted from the ATA.
Figure 9. management recommendations in patients with Follicular Neoplasms
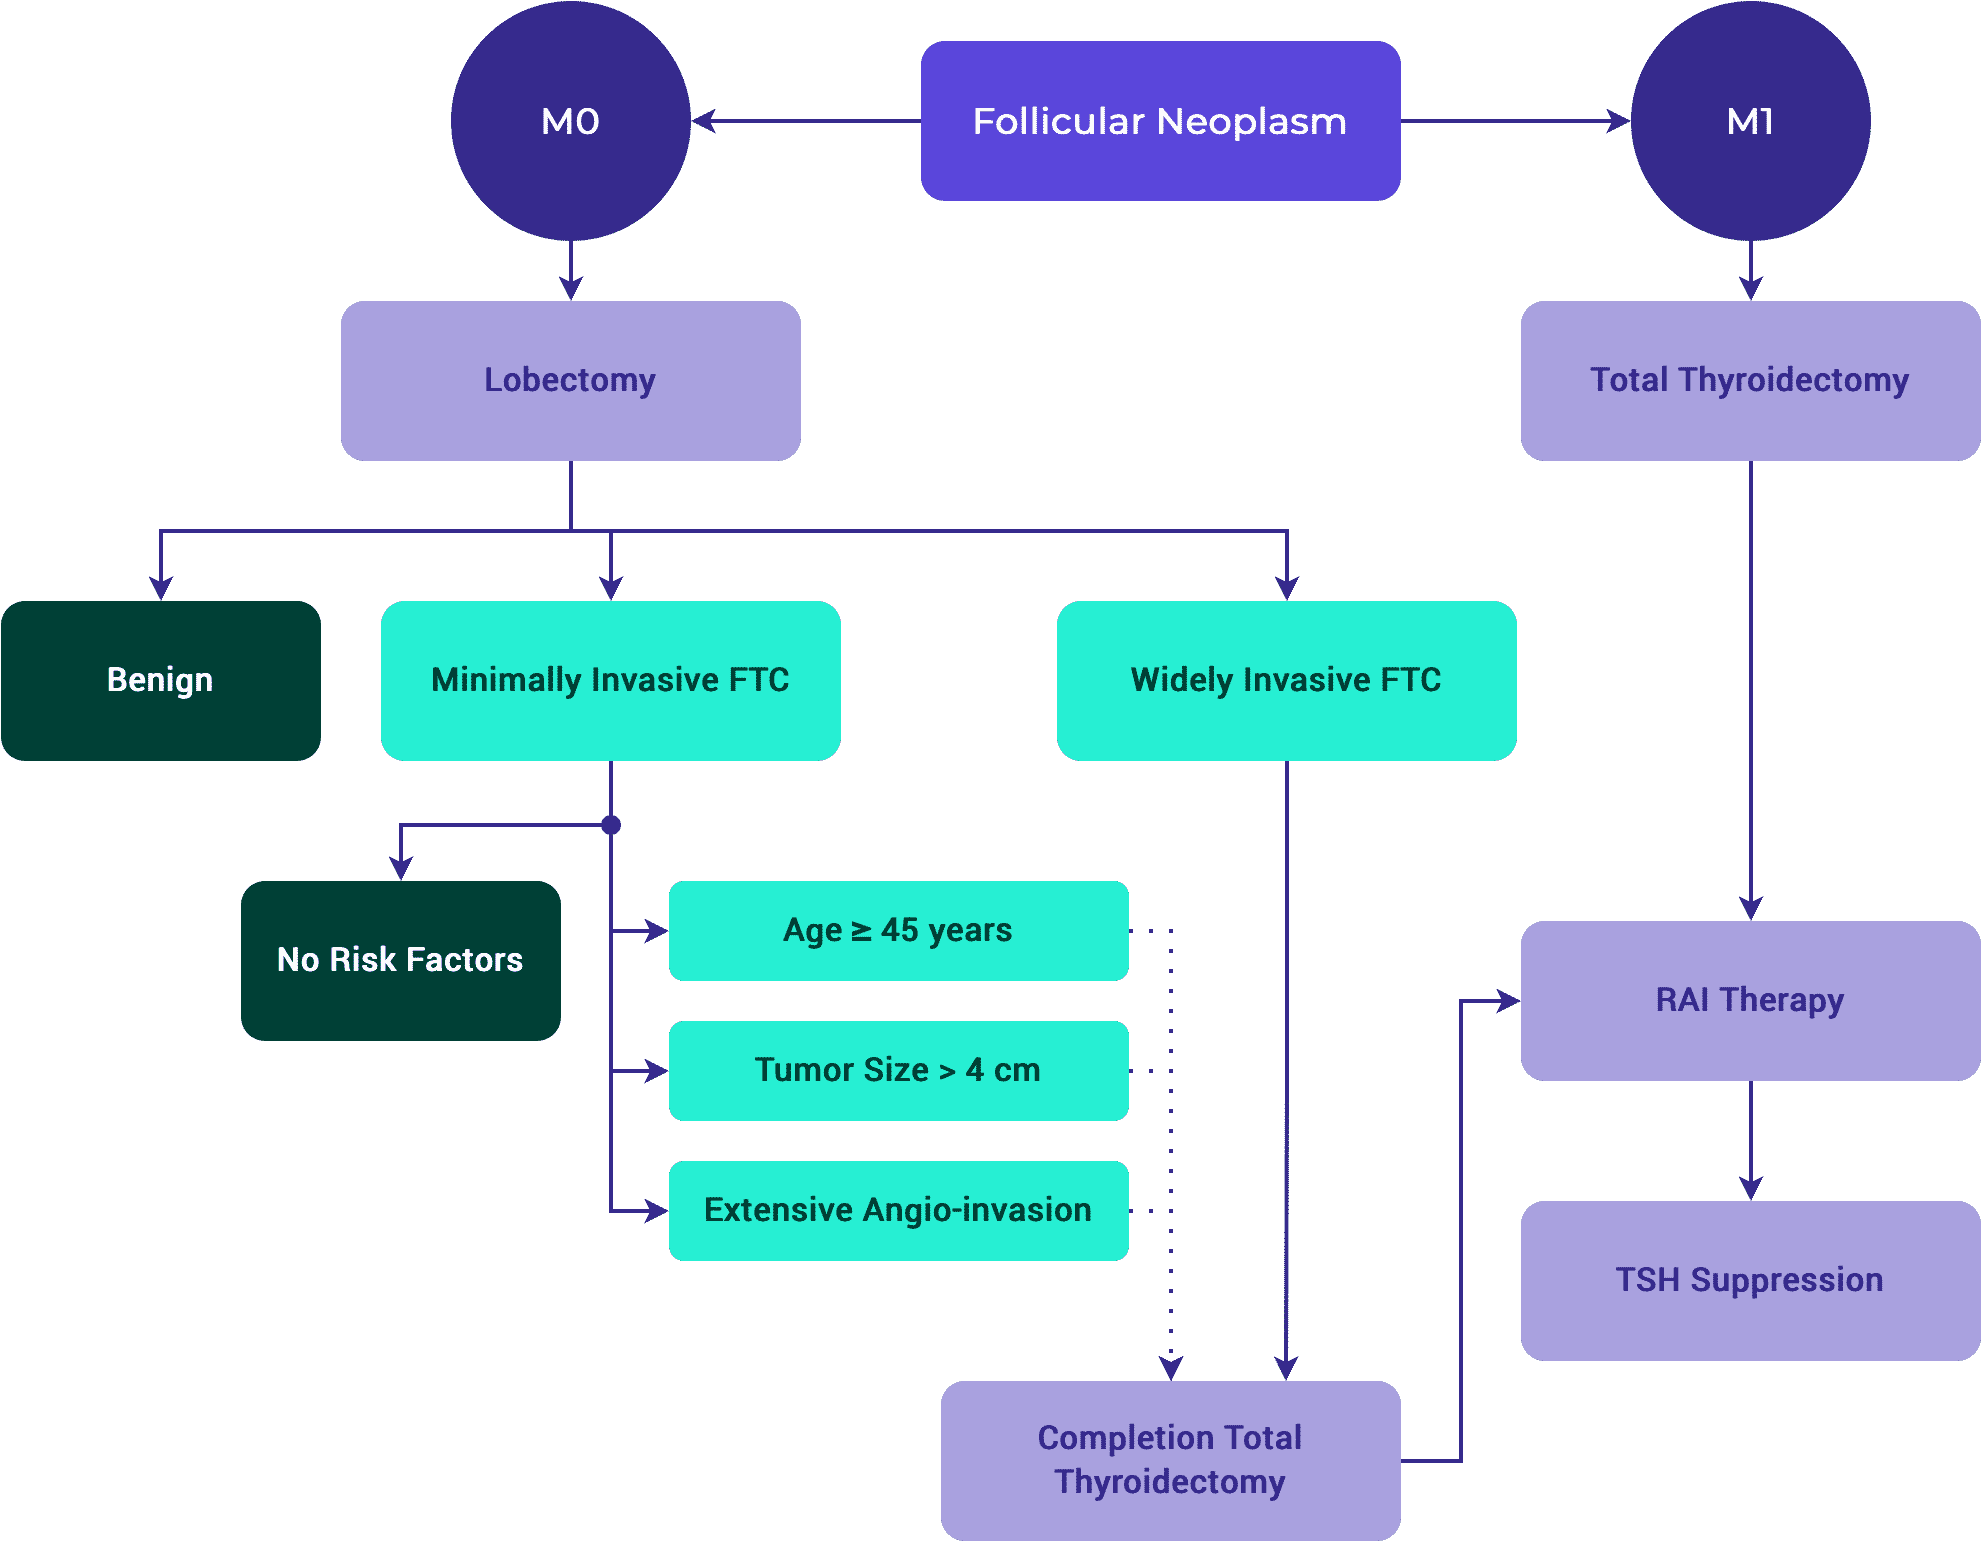
Adapted from the ATA.
Response to Therapy Based on Initial Management
Tables & Figures
Table 2a. Response to Therapy: Total Thyroidectomy & RRA (ATA compared to ESMO)
ATA // ESMO
Response to Therapy
Excellent
| Imaging |
| No relevant findings on imaging. |
| TSH-Suppressed Tg |
| < 0.2 ng/mL |
| TSH-Stim TG |
| < 1 ng/mL |
| TgAB |
| • Not specified (ATA) • Undetectable (ESMO) |
Biochem Incomplete
| Imaging |
| No relevant findings on imaging. |
| TSH-Suppressed Tg |
| 1 ng/mL |
| TSH-Stim TG |
| 10 ng/mL |
| TgAB |
| Rising TgAB levels |
Structural Incomplete
| Imaging |
| Evidence of structural or functional disease. * |
| TSH-Suppressed Tg |
| * |
| TSH-Stim TG |
| * |
| TgAB |
| * |
Indeterminate
| Imaging |
| Nonspecific findings on US/CT. — OR — Faint uptake in thyroid bed on RAI scanning. |
| TSH-Suppressed Tg |
| • Tg detectable, but < 1 ng/mL (ATA) • 0.2–1 ng/mL (ESMO) |
| TSH-Stim TG |
| • Stimulated Tg detectable, but < 10 ng/mL (ATA) • 1–10 ng/mL (ESMO) |
| TgAB |
| TgAB levels stable or declining in the absence of structural or functional disease. |
* Regardless of Tg or TgAB levels.
Table 2b. Response to Therapy: Total Thyroidectomy Alone
ESMO
Response to Therapy
Excellent
| Imaging |
| No relevant findings on imaging. |
| TSH-Suppressed Tg |
| < 0.2 ng/mL |
| TSH-Stim TG |
| Not Specified |
| TgAB |
| Undetectable |
Biochem Incomplete
| Imaging |
| No relevant findings on imaging. |
| TSH-Suppressed Tg |
| Tg > 5 ng/mL – OR – Rising Tg values with similar TSH levels. |
| TSH-Stim TG |
| — |
| TgAB |
| Rising TgAB levels |
Structural Incomplete
| Imaging |
| Evidence of structural or functional disease. * |
| TSH-Suppressed Tg |
| * |
| TSH-Stim TG |
| * |
| TgAB |
| * |
Indeterminate
| Imaging |
| Nonspecific findings on US/CT. — OR — Faint uptake in thyroid bed on RAI scanning. |
| TSH-Suppressed Tg |
| < 0.2–5 ng/mL |
| TSH-Stim TG |
| Not Specified |
| TgAB |
| TgAB levels stable or declining in the absence of structural or functional disease. |
* Regardless of Tg or TgAB levels.
Table 2c. Response to Therapy: Lobectomy Alone
ESMO
Response to Therapy
Excellent
| Imaging |
| No relevant findings on imaging. |
| TSH-Suppressed Tg |
| Stable |
| TSH-Stim TG |
| Stable |
| TgAB |
| Undetectable |
Biochem Incomplete
| Imaging |
| No relevant findings on imaging. |
| TSH-Suppressed Tg |
| Rising Tg values with similar TSH levels |
| TSH-Stim TG |
| TgAB |
| Rising |
Structural Incomplete
| Imaging |
| Evidence of structural or functional disease. * |
| TSH-Suppressed Tg |
| * |
| TSH-Stim TG |
| * |
| TgAB |
| * |
Indeterminate
| Imaging |
| Nonspecific findings on US/CT. |
| TSH-Suppressed Tg |
| * |
| TSH-Stim TG |
| * |
| TgAB |
| * |
* Regardless of Tg or TgAB levels.
Genetic Alterations & Histologic Features
Tables & Figures
Table 7. Gene Alterations & Histology
Phenotype
Toxic Adenoma
Known Somatic Genetic Mutation / Alterations
- TSH-R
- GNAS
Benign Thyroid Nodules
Known Somatic Genetic Mutation / Alterations
- N-, H- and K-RAS
- EIF1AX
Noninvasive Follicular Tumor with Papillary-like Features (NIFTP)
Known Somatic Genetic Mutation / Alterations
- N-, H- and K-RAS
- BRAF K601E
Infiltrative Follicular Variant Papillary Thyroid Carcinoma (FVPTC)
Known Somatic Genetic Mutation / Alterations
- N-, H- and K-RAS
- BRAF V600E
Papillary Thyroid Carcinoma (PTC)
Known Somatic Genetic Mutation / Alterations
- RET/PTC
- BRAF V600E
- N-, H-, K-RAS
- TERT
Columnar Cell, Tall Cell, Hobnail Variant PTC
Known Somatic Genetic Mutation / Alterations
- BRAF V600E
Diffuse-sclerosing Variant PTC
Known Somatic Genetic Mutation / Alterations
- RET/PTC
Follicular Thyroid Carcinoma (FTC)
Known Somatic Genetic Mutation / Alterations
- N-, H- and K-RAS
- PAX8/PPAR
- PTEN
Hürthle Cell Carcinoma
Known Somatic Genetic Mutation / Alterations
- NRAS
- Genes in the PI3K-Akt Pathway
Poorly Differentiated Thyroid Carcinoma (PDTC)
Known Somatic Genetic Mutation / Alterations
- N-RAS (Insular)
- BRAF V600E
- PIK3CA
- RET/PTC
- TERT
Anaplastic Thyroid Carcinoma (ATC)
Known Somatic Genetic Mutation / Alterations
- N-RAS, BRAF V600E
- PIK3CA
- TP53
- β-catenin
- EIF1AX
Medullary Thyroid Carcinoma (MTC)
Known Somatic Genetic Mutation / Alterations
- RET (Germ Line Mutation in Inherited MTC, Somatic Mutation)
- N-, H- and K-RAS (Somatic Mutations)
Adapted with permission from Wolters Kluwer Health, Inc.: the author(s), titles of article, title of journal, volume number, issue number, inclusive pages and website URL to the journal page.
Table 8. Histologic Subtypes of PTC
Subtype
Follicular-variant
| Nuclear Features of PTC Present? |
| Yes |
| Characteristics |
| • RAS mutation more common. • Follicular growth pattern. |
| Prognosis |
| 10-year DSS 93% |
Follicular-variant Encapsulated, Invasive
| Nuclear Features of PTC Present? |
| — |
| Characteristics |
| • RAS mutation or PPARG rearrangement more common. • Low rate of LNM. |
| Prognosis |
| 10-year DSS ~100% |
Follicular-variant Nonencapsulated / Infiltrative
| Nuclear Features of PTC Present? |
| — |
| Characteristics |
| BRAF V600E more common. |
| Prognosis |
| Equivalent to classic / conventional PTC |
Columnar Cell
| Nuclear Features of PTC Present? |
| No |
| Characteristics |
| • Papillae lined by columnar cells with nuclear stratification. • Large tumors with capsular invasion are associated with LNM and DM. |
| Prognosis |
| Variable |
Cribiform Morular
| Nuclear Features of PTC Present? |
| Occasionally |
| Characteristics |
| • Presence of morules—squamoid areas with intranuclear inclusions and nuclear clearing. • Associated with Familial Adenomatosis Polyposis Syndrome. |
| Prognosis |
| Equivalent to classic / conventional PTC |
Classic / Conventional
| Nuclear Features of PTC Present? |
| Yes |
| Characteristics |
| LNM Common |
| Prognosis |
| • 5-year DSS 97.4% • 10-year DSS 93% |
Diffuse Sclerosing
| Nuclear Features of PTC Present? |
| Yes |
| Characteristics |
| • Diffuse fibrosis. • Dense lymphoid infiltration. • Squamous metaplasia. |
| Prognosis |
| • 5-year DSS 96% • Equivalent to high-risk PTC |
Tall Cell
| Nuclear Features of PTC Present? |
| Yes |
| Characteristics |
| • Extrathyroidal extension and LNM possible. • > 30% cells are 2x tall as wide and eosinophilic cytoplasm. |
| Prognosis |
| 5-year DSS 95.6% |
Hobnail
| Nuclear Features of PTC Present? |
| Yes |
| Characteristics |
| • Increased risk of DM. • > 30% have hobnail features (eccentric nuclei and tapering cytoplasm). • Syncytial or micropapillary clusters with apically placed nuclei. • BRAF V600E or p53 positive |
| Prognosis |
| 5-year DSS 83% |
Adapted with permission from Wolters Kluwer Health, Inc.: the author(s), titles of article, title of journal, volume number, issue number, inclusive pages and website URL to the journal page.
Use of Radioactive Iodine
Tables & Figures
Table 9. Remnant Ablation Decision Making
Tumor Description
Tumor ≤ 1 cm
| ATA Risk | Low |
| Disease specific survival improved by RAI | No |
| Disease free survival improved by RAI | No* |
| RAI indicated | No |
Tumor > 1–4 cm
| ATA Risk | Low |
| Disease specific survival improved by RAI | No |
| Disease free survival improved by RAI | Unclear data* |
| RAI indicated | Not routinely |
Tumor > 4 cm
| ATA Risk | Low |
| Disease specific survival improved by RAI | Unclear data* |
| Disease free survival improved by RAI | Unclear data* |
| RAI indicated | Consider |
Micro ETE (Any tumor size)
| ATA Risk | Low / Intermediate |
| Disease specific survival improved by RAI | No |
| Disease free survival improved by RAI | Unclear data* |
| RAI indicated | Consider |
Central LN Mets
| ATA Risk | Low / Intermediate |
| Disease specific survival improved by RAI | No |
| Disease free survival improved by RAI | Unclear data* |
| RAI indicated | Consider |
Lateral or Mediastinal LN Mets
| ATA Risk | Low / Intermediate |
| Disease specific survival improved by RAI | No |
| Disease free survival improved by RAI | Unclear data* |
| RAI indicated | Consider |
Any Size Gross ETE
| ATA Risk | High |
| Disease specific survival improved by RAI | Yes |
| Disease free survival improved by RAI | Yes* |
| RAI indicated | Yes |
Distant Metastasis
| ATA Risk | High |
| Disease specific survival improved by RAI | Yes |
| Disease free survival improved by RAI | Yes* |
| RAI indicated | Yes |
* Conflicting observational data.
The publisher for this copyrighted material is Mary Ann Liebert, Inc. publishers. This table is reprinted and adapted from THYROID.
Medullary Thyroid Cancer
Initial Evaluation of Thyroid Nodules Suspicious of MTC
Tables & Figures
Table 12. Most Common RET Mutations with Associated Risks
RET Mutation
Highest Risk Level (HST)
M918T
| RET Exon | 16 |
| Risk of Aggressive MTC | Highest |
| Incidence of Pheochromocytoma | 50% |
| Incidence of Hyperparathyroidism | – |
High Risk Level (H)
C634F/G/R/S/W/Y
| RET Exon | 11 |
| Risk of Aggressive MTC | High |
| Incidence of Pheochromocytoma | 50% |
| Incidence of Hyperparathyroidism | 20–30% |
A883F
| RET Exon | 15 |
| Risk of Aggressive MTC | High |
| Incidence of Pheochromocytoma | 50% |
| Incidence of Hyperparathyroidism | – |
Moderate Risk Level (MOD)
G533C
| RET Exon | 8 |
| Risk of Aggressive MTC | Moderate |
| Incidence of Pheochromocytoma | 10% |
| Incidence of Hyperparathyroidism | – |
C609F/G/R/S/Y
| RET Exon | 10 |
| Risk of Aggressive MTC | Moderate |
| Incidence of Pheochromocytoma | 10–30% |
| Incidence of Hyperparathyroidism | 10% |
C611F/G/S/Y/W
| RET Exon | 10 |
| Risk of Aggressive MTC | Moderate |
| Incidence of Pheochromocytoma | 10–30% |
| Incidence of Hyperparathyroidism | 10% |
C618F/R/S
| RET Exon | 10 |
| Risk of Aggressive MTC | Moderate |
| Incidence of Pheochromocytoma | 10–30% |
| Incidence of Hyperparathyroidism | 10% |
C620F/R/S
| RET Exon | 10 |
| Risk of Aggressive MTC | Moderate |
| Incidence of Pheochromocytoma | 10–30% |
| Incidence of Hyperparathyroidism | 10% |
C630R/Y
| RET Exon | 11 |
| Risk of Aggressive MTC | Moderate |
| Incidence of Pheochromocytoma | 10–30% |
| Incidence of Hyperparathyroidism | 10% |
D631Y
| RET Exon | 11 |
| Risk of Aggressive MTC | Moderate |
| Incidence of Pheochromocytoma | 50% |
| Incidence of Hyperparathyroidism | – |
K666E
| RET Exon | 11 |
| Risk of Aggressive MTC | Moderate |
| Incidence of Pheochromocytoma | 10% |
| Incidence of Hyperparathyroidism | – |
E768D
| RET Exon | 13 |
| Risk of Aggressive MTC | Moderate |
| Incidence of Pheochromocytoma | – |
| Incidence of Hyperparathyroidism | – |
L790F
| RET Exon | 13 |
| Risk of Aggressive MTC | Moderate |
| Incidence of Pheochromocytoma | 10% |
| Incidence of Hyperparathyroidism | – |
V804L/M
| RET Exon | 14 |
| Risk of Aggressive MTC | Moderate |
| Incidence of Pheochromocytoma | 10% |
| Incidence of Hyperparathyroidism | 10% |
S891A
| RET Exon | 15 |
| Risk of Aggressive MTC | Moderate |
| Incidence of Pheochromocytoma | 10% |
| Incidence of Hyperparathyroidism | 10% |
R912P
| RET Exon | 16 |
| Risk of Aggressive MTC | Moderate |
| Incidence of Pheochromocytoma | – |
| Incidence of Hyperparathyroidism | – |
Table adapted from Table 4, Wells et al, Revised ATA guidelines for the management of medullary thyroid carcinoma, Thyroid 2015. The publisher for this copyrighted material is Mary Ann Liebert, Inc. publishers.
Management of Inherited Forms
Tables & Figures
Figure 12. ATA Management of Patients with RET Germline Mutation Detected on Genetic Screening.
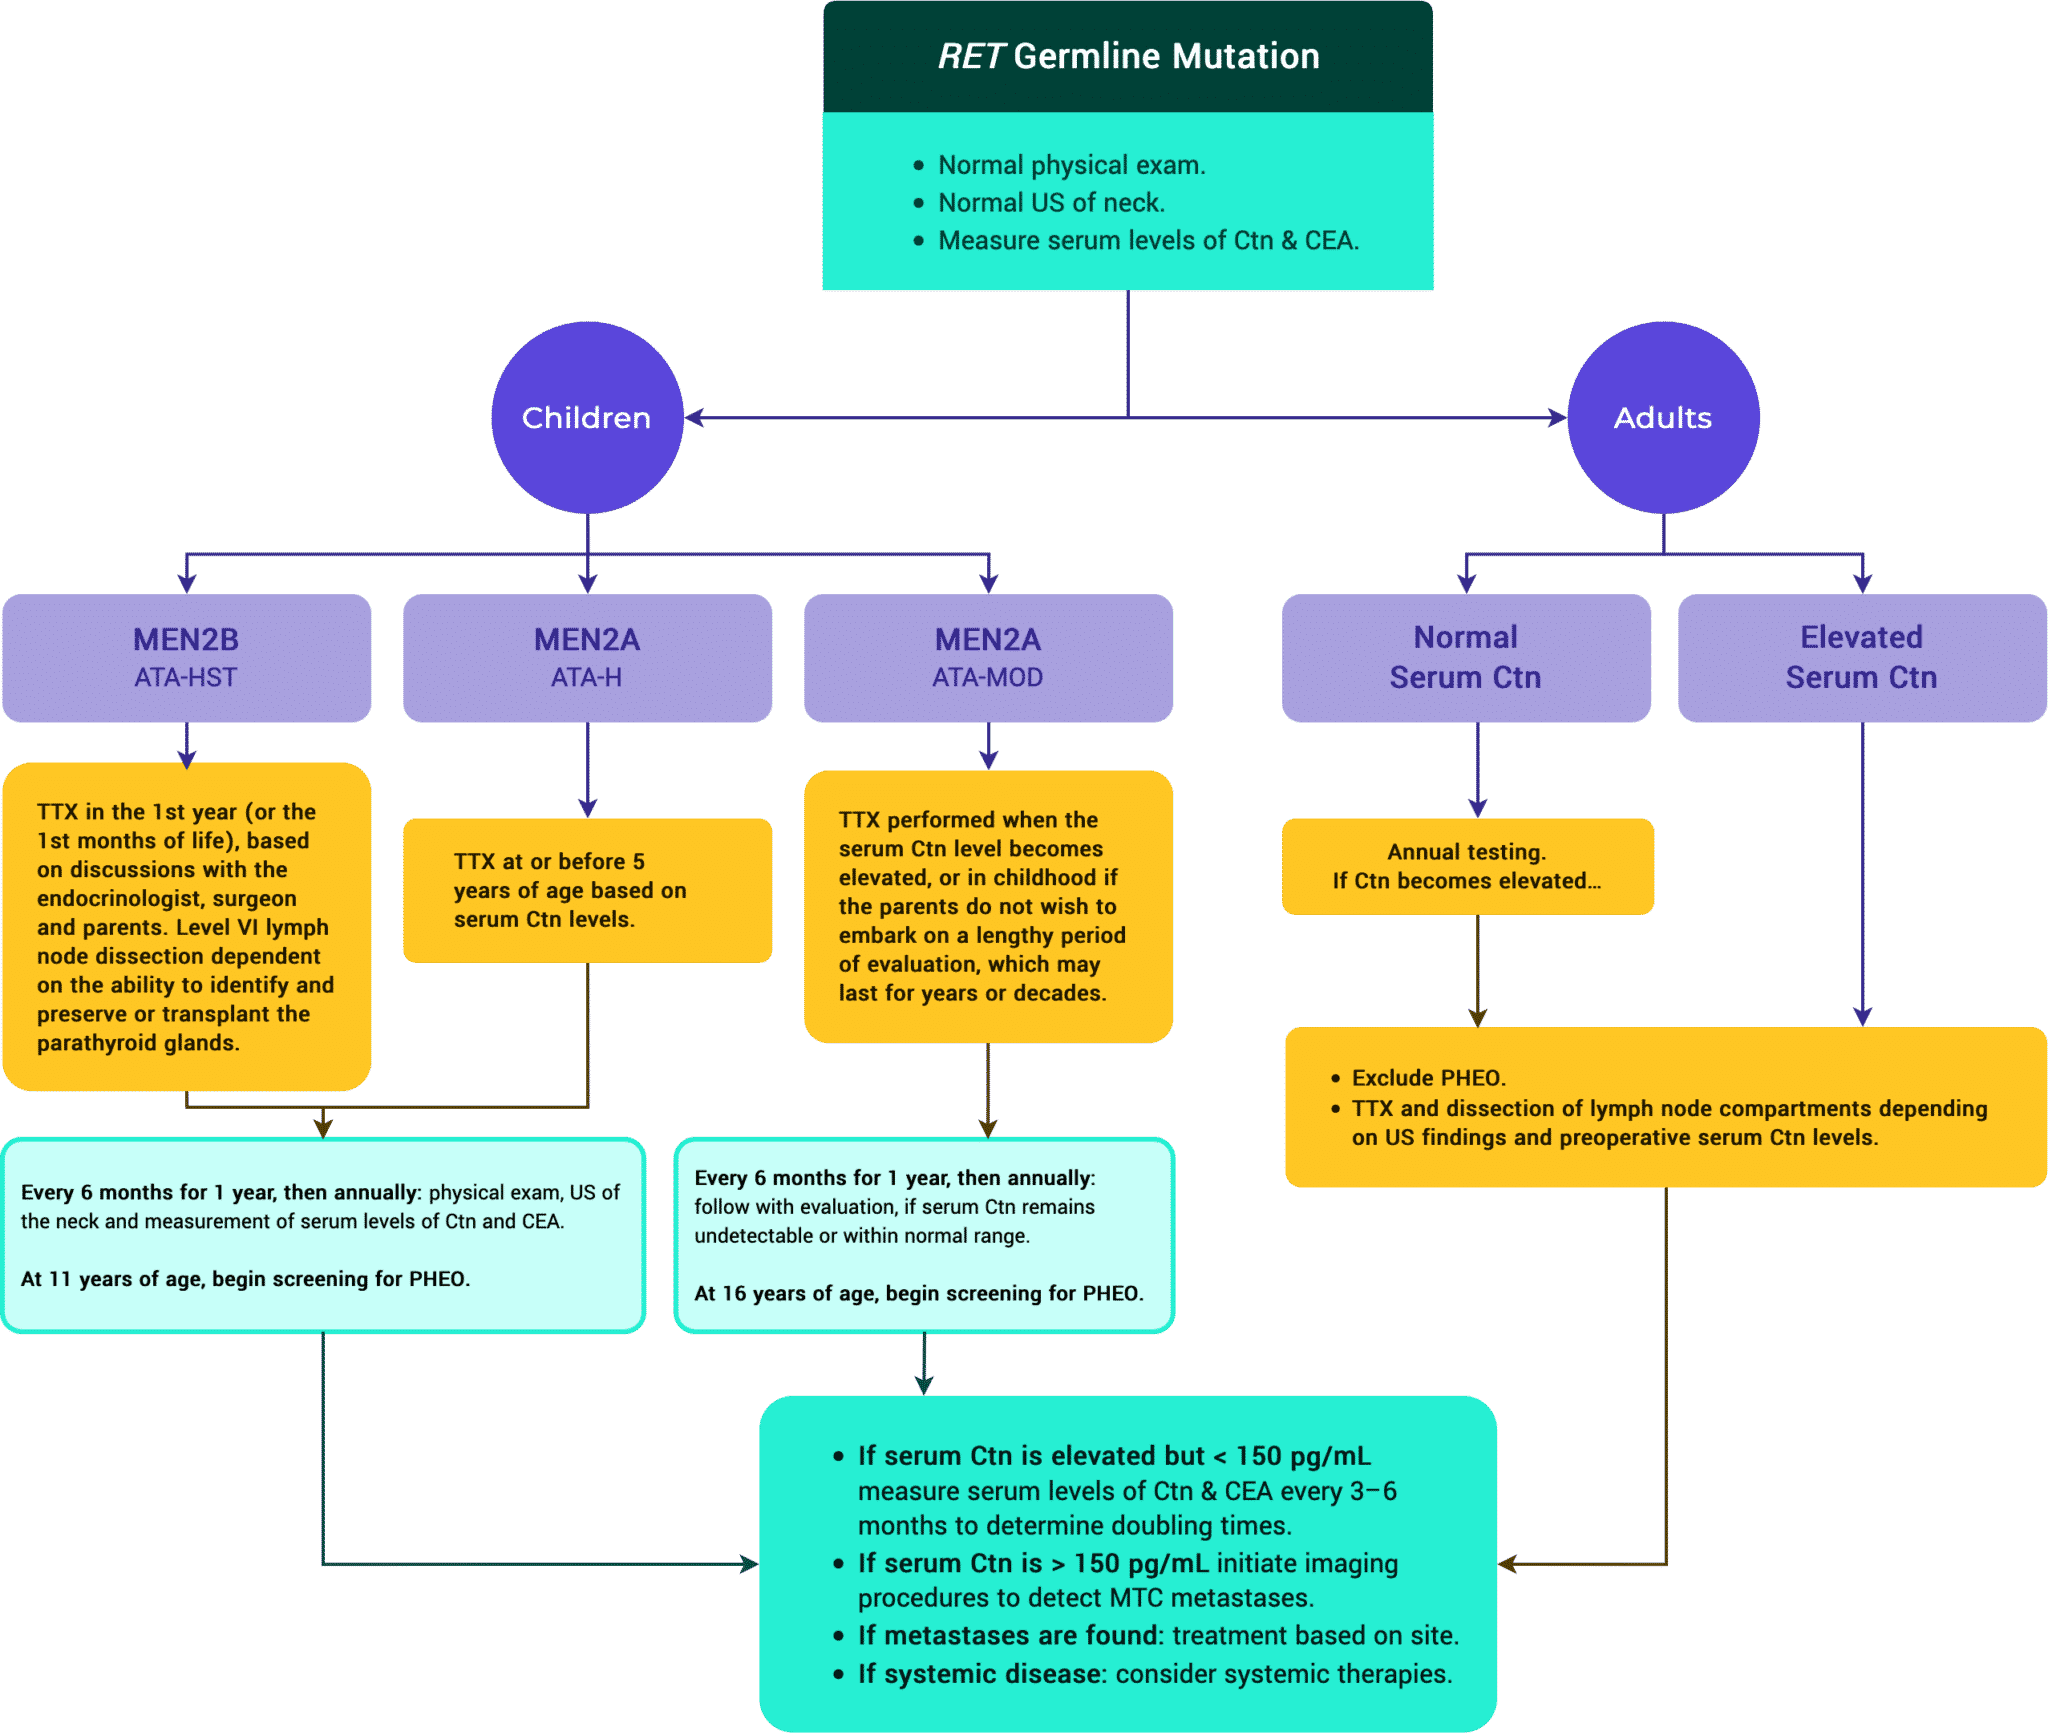
Table 12. Most Common RET Mutations with Associated Risks
RET Mutation
Highest Risk Level (HST)
M918T
| RET Exon | 16 |
| Risk of Aggressive MTC | Highest |
| Incidence of Pheochromocytoma | 50% |
| Incidence of Hyperparathyroidism | – |
High Risk Level (H)
C634F/G/R/S/W/Y
| RET Exon | 11 |
| Risk of Aggressive MTC | High |
| Incidence of Pheochromocytoma | 50% |
| Incidence of Hyperparathyroidism | 20–30% |
A883F
| RET Exon | 15 |
| Risk of Aggressive MTC | High |
| Incidence of Pheochromocytoma | 50% |
| Incidence of Hyperparathyroidism | – |
Moderate Risk Level (MOD)
G533C
| RET Exon | 8 |
| Risk of Aggressive MTC | Moderate |
| Incidence of Pheochromocytoma | 10% |
| Incidence of Hyperparathyroidism | – |
C609F/G/R/S/Y
| RET Exon | 10 |
| Risk of Aggressive MTC | Moderate |
| Incidence of Pheochromocytoma | 10–30% |
| Incidence of Hyperparathyroidism | 10% |
C611F/G/S/Y/W
| RET Exon | 10 |
| Risk of Aggressive MTC | Moderate |
| Incidence of Pheochromocytoma | 10–30% |
| Incidence of Hyperparathyroidism | 10% |
C618F/R/S
| RET Exon | 10 |
| Risk of Aggressive MTC | Moderate |
| Incidence of Pheochromocytoma | 10–30% |
| Incidence of Hyperparathyroidism | 10% |
C620F/R/S
| RET Exon | 10 |
| Risk of Aggressive MTC | Moderate |
| Incidence of Pheochromocytoma | 10–30% |
| Incidence of Hyperparathyroidism | 10% |
C630R/Y
| RET Exon | 11 |
| Risk of Aggressive MTC | Moderate |
| Incidence of Pheochromocytoma | 10–30% |
| Incidence of Hyperparathyroidism | 10% |
D631Y
| RET Exon | 11 |
| Risk of Aggressive MTC | Moderate |
| Incidence of Pheochromocytoma | 50% |
| Incidence of Hyperparathyroidism | – |
K666E
| RET Exon | 11 |
| Risk of Aggressive MTC | Moderate |
| Incidence of Pheochromocytoma | 10% |
| Incidence of Hyperparathyroidism | – |
E768D
| RET Exon | 13 |
| Risk of Aggressive MTC | Moderate |
| Incidence of Pheochromocytoma | – |
| Incidence of Hyperparathyroidism | – |
L790F
| RET Exon | 13 |
| Risk of Aggressive MTC | Moderate |
| Incidence of Pheochromocytoma | 10% |
| Incidence of Hyperparathyroidism | – |
V804L/M
| RET Exon | 14 |
| Risk of Aggressive MTC | Moderate |
| Incidence of Pheochromocytoma | 10% |
| Incidence of Hyperparathyroidism | 10% |
S891A
| RET Exon | 15 |
| Risk of Aggressive MTC | Moderate |
| Incidence of Pheochromocytoma | 10% |
| Incidence of Hyperparathyroidism | 10% |
R912P
| RET Exon | 16 |
| Risk of Aggressive MTC | Moderate |
| Incidence of Pheochromocytoma | – |
| Incidence of Hyperparathyroidism | – |
Table adapted from Table 4, Wells et al, Revised ATA guidelines for the management of medullary thyroid carcinoma, Thyroid 2015. The publisher for this copyrighted material is Mary Ann Liebert, Inc. publishers.
Anaplastic Thyroid Cancer
Tables & Figures
Table 16. Panel of Routine Immunohistochemical Markers
IHC Marker
Pan-cytokeratins
| DTC | +++ |
| PDTC | +++ |
| ATC | +++/– |
| MTC | +++ |
| SCC | +++ |
| Lymphoma | – |
Thyroglobulin
| DTC | +++ |
| PDTC | +/– |
| ATC | – |
| MTC | – |
| SCC | – |
| Lymphoma | – |
Thyroid-transcription factor 1
| DTC | +++ |
| PDTC | +/– |
| ATC | –/+ |
| MTC | +/– |
| SCC | – |
| Lymphoma | – |
BRAFV600E
| DTC | +/– |
| PDTC | –/+ |
| ATC | –/+ |
| MTC | – |
| SCC | – |
| Lymphoma | – |
PAX8
| DTC | +++ |
| PDTC | +++ |
| ATC | +/– |
| MTC | +/– |
| SCC | – |
| Lymphoma | +/–a |
Ki-67b
| DTC | < 5% |
| PDTC | 5–30% |
| ATC | > 30% |
| MTC | < 20% |
| SCC | > 30% |
| Lymphoma | variable |
Chromogranin
| DTC | – |
| PDTC | – |
| ATC | – |
| MTC | +++ |
| SCC | – |
| Lymphoma | – |
Calcitonin
| DTC | – |
| PDTC | – |
| ATC | – |
| MTC | +++/– |
| SCC | – |
| Lymphoma | – |
Carcinembryonic antigen
| DTC | – |
| PDTC | – |
| ATC | – |
| MTC | +++ |
| SCC | – |
| Lymphoma | – |
p53
| DTC | – (rare +) |
| PDTC | –/+ |
| ATC | +/– |
| MTC | – |
| SCC | +/– |
| Lymphoma | +/– |
CD45, other lymphoid markers
| DTC | – |
| PDTC | – |
| ATC | – |
| MTC | – |
| SCC | – |
| Lymphoma | +++ |
“+” = relative positive staining; “–” = negative staining; “+/–” = variable positivity.
a PAX8 antibodies can cross-react with PAX5, which is expressed in lymphoid cells.
b Percentage of nuclei positive for Ki-67.
DTC = differentiated thyroid cancer; IHC = immunohistochemistry; MTC = medullary thyroid cancer; PDTC = poorly-differentiated thyroid cancer.
Table 13. T Staging for ATC
T Stage
T1
Description
< 2 cm
T2
Description
> 2 cm and < 4 cm
T3a
Description
> 4 cm
T3b
Description
Invasion of the strap muscles.
T4a
Description
Any size cancer with invasion of the larynx, trachea, esophagus, or the recurrent laryngeal nerve.
T4b
Description
Any size cancer with extension to the vertebrae or involvement of the carotid artery.
Adapted from the 8th edition AJCC.
Table 14. Prognostic Staging for ATC
Figure 13. Treatment Algorithm of ATC
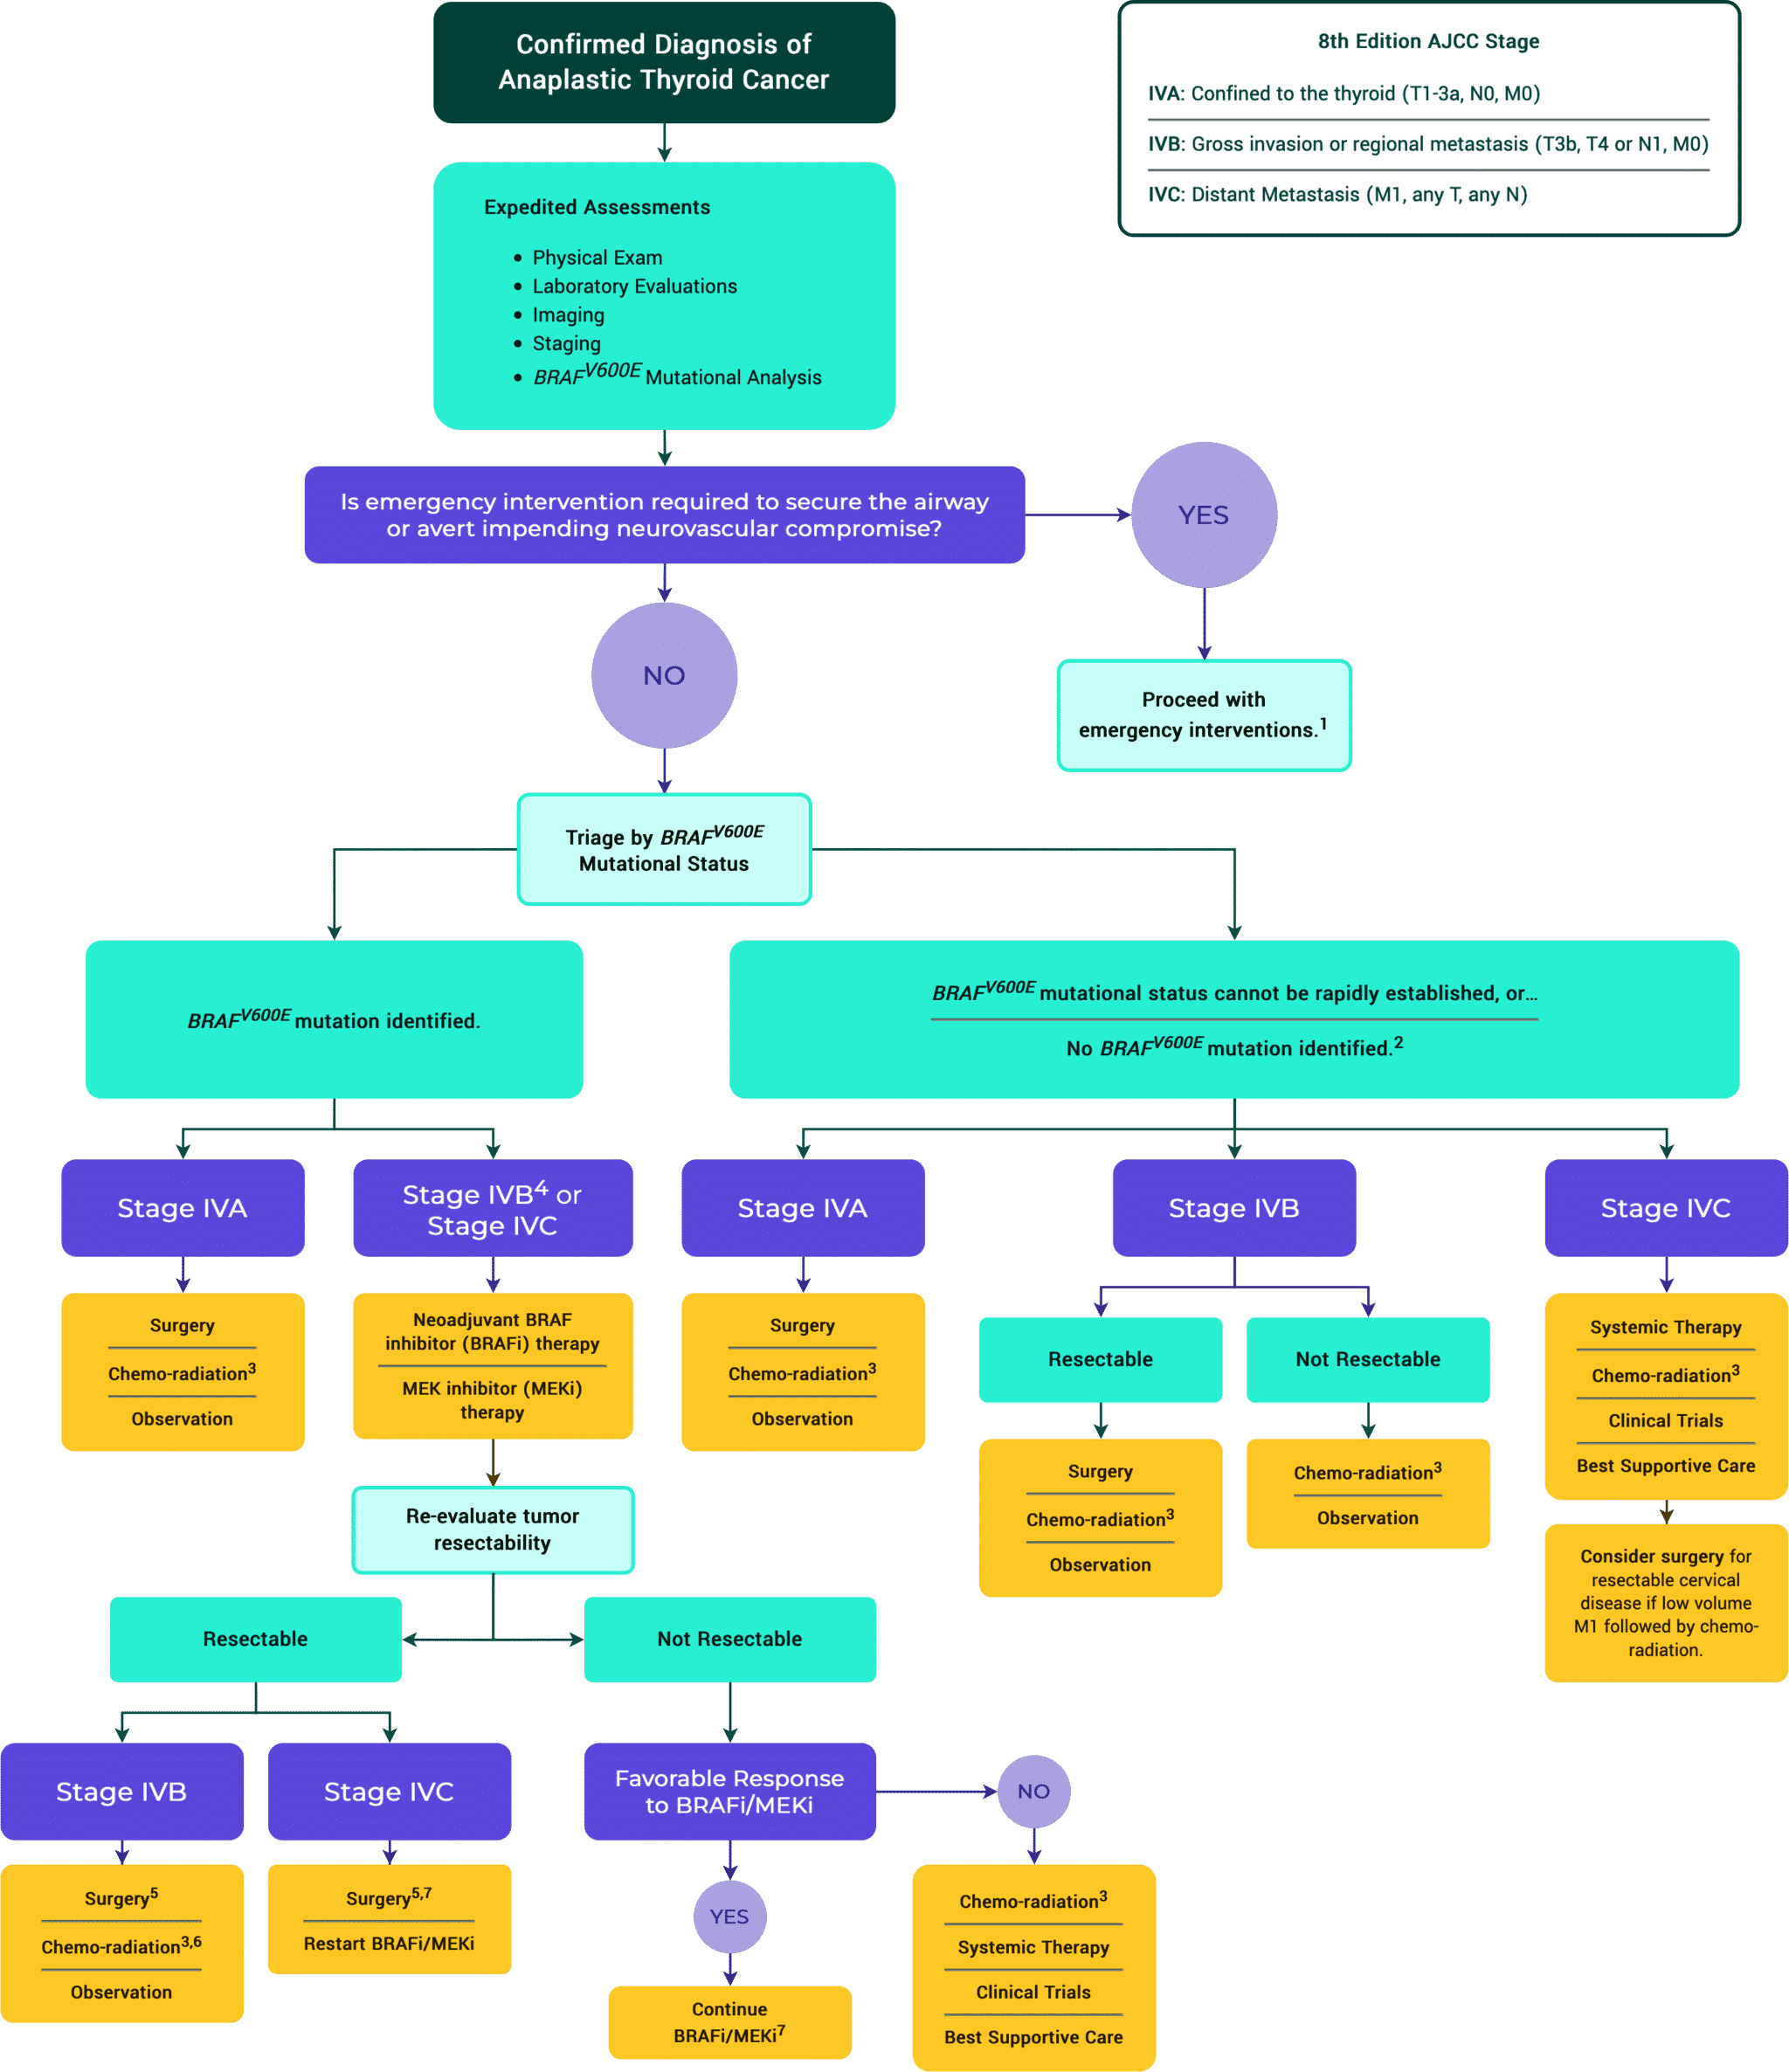
2 Next generation sequencing to identify targetable mutations is recommended. Specific inhibitors of oncogenic ALK, NTRK or RET fusion mutations can be considered, preferably within the context of a clinical trial.
3 Chemo-radiation: Typically, intensity-modulated radiation therapy is given to 70 Gy to gross tumor, 60–66 Gy to the post-op-bed and 50–54 Gy to potential microscopic residual disease regions with standard daily fractionation. The dose of radiation can change if clinically indicated. QUAD shot RT regimen can also be considered, typically for M1 disease, (3.7Gy BID x 2 days, can give up to 4–6 cycles, allow 1–4 weeks in between cycle pending on clinical scenario). At MSKCC, doxorubicin 20 mg/m2 weekly or paclitaxel 50 mg/m2 weekly is used throughout the radiation course but there are other reasonable regimens described in the literature.
4 If resectable, surgery followed by chemo-radiation can be considered as an alternative to neoadjuvant BRAFi/MEKi.
5 Discontinue BRAF inhibitor/MEK inhibitor therapy 2 days before surgery and resume 2–3 days after surgery.
6 Discontinue BRAF inhibitor/MEK inhibitor therapy 2 days before initiation of chemo-radiation.
7 Consider radiation therapy if it can be done without causing a significant delay in BRAF inhibitor/MEK inhibitor therapy.
Table 17. Mutations & Clinical Implications.
Mutations
BRAFV600E
Clinical Implications
Commonly seen in DTC which may be precursor to ATC.
Incidence in ATC
40–70% of ATCs and often seen in ATC arising from PTC.
RAS
Clinical Implications
Commonly seen in DTC which may be precursor to ATC.
Incidence in ATC
—
TP53
Clinical implications
Considered late stage in the carcinogenesis process. More commonly found in ATC.
Incidence in ATC
Found in 50–70% of ATC.
TERT
Clinical Implications
Considered late stage in the carcinogenesis process. More commonly found in ATC.
Incidence in ATC
Seen in 65–75% of ATC.
P13K/AKT
Clinical Implications
Considered late stage in the carcinogenesis process.
Incidence in ATC
30–40% of ATC.
EIF1AX
Clinical Implications
Often present with RAS mutations.
Incidence in ATC
—
None of the above mutations, although found in ATCs, is diagnostic for ATC.
Copyright & Licensing
All of the resources created for TIRO are licensed under Creative Commons Attribution-ShareAlike 4.0 International![]()
![]()
![]()
This license requires that reusers give credit to the creator. It allows reusers to distribute, remix, adapt, and build upon the material in any medium or format, even for commercial purposes. If others remix, adapt, or build upon the material, they must license the modified material under identical terms.
This means that you may use any of our figures or tables in a presentation or publication. If you do, simply give credit by citing the following text in your sources or footnotes:
Example Citation
Figure 13. Diagnosis Algorithm of ATC. Copyright © TIRO, THANC Foundation. All rights reserved. Available at: https://tiro.expert
What is TIRO?
TIRO (Thyroid International Recommendations Online) is a compilation of multiple, widely-recognized international thyroid nodule and thyroid cancer guidelines from the United States, Europe and Japan. TIRO puts all of the most up-to-date guidelines in one easy to access site.
In addition, it compares and contrasts international thyroid cancer and thyroid nodule guidelines, white papers and recommendations in a way that identifies where guidelines align and where discrepancies exist. It acts as a dynamic resource for clinicians on contemporary topics via weekly journal clubs, lectures, tumor boards and round table discussions. This program is led by a multidisciplinary board composed of top thyroid specialists from around the world.
Evidence in thyroid nodule and thyroid cancer care changes at a rapid pace.
Guideline-based care is often outdated due to this explosion of new evidence. TIRO (Thyroid International Recommendations Online) brings that evidence to clinicians in the context of guideline based recommendations.
Easy to Navigate
Compare & Contrast
Dynamic & Up-to-date
Access Expert Opinions
Why We Created TIRO
TIRO was developed in an effort to place guideline-based recommendations at the fingertips of clinicians who are managing patients with both thyroid nodules and thyroid cancer. In many respects, by collating information from multiple sources, TIRO is the thyroid guideline of all guidelines™.
The current published guidelines are static and both difficult to access and challenging to navigate. TIRO is designed to address these issues and to facilitate the delivery of optimal patient care at the point of care. In addition, the current guidelines are often outdated soon after they are published. In many instances, the published recommendations are based on less than optimal evidence, as well as expert opinion where quality evidence does not exist.
TIRO aims to offset these traditional handicaps. The goal of TIRO is to provide relevant, updated information in specific areas where the evidence is weak and where discrepancies exist across guidelines that have been reviewed. This process is based on the tremendous amount of new studies that are published in the literature on a regular basis and which are highlighted in our weekly virtual educational sessions that are delivered and recorded and then strategically placed in the relevant locations within the recommendation sections of TIRO. In this way, we intend to provide a dynamic and continually updated resource.

Endocrinology
Brigham & Women’s Hospital
Boston, MA

Pathology
Penn Medicine
Philadelphia, PA

Pediatric Endocrinology
University of Pennsylvania
Philadelphia, PA

Endocrinology
Mayo Clinic
Rochester, MN

Endocrinology
MD Anderson
Houston, TX

Cytopathology & Histopathology
Massachusetts General Hospital
Boston, MA

Endocrinology
Universidad Autonoma de Nuevo León
Monterrey, Mexico

Head & Neck Surgery
Gustave Roussy
Paris, France

Cytopathology & Histopathology
UCLA Health
Los Angeles, CA

Radiology
Penn Medicine
Philadelphia, PA

Radiation Oncology
The Royal Marsden
London, UK

Head & Neck Surgery
Stanford
Palo Alto, CA

Endocrine Surgery
University of Calgary
Alberta, Canada

Nuclear Medicine
Royal Brisbane Hospital
Brisbane, Australia

Endocrinology
Universidad de Buenos Aires
Buenos Aires, Argentina

Endocrinology
Rabin Medical Center
Israel

Nuclear Medicine
Prince of Wales Hospital
Sydney, Australia

Endocrinology
University of Washington
Seattle, WA

Endocrine Surgery
Nippon Medical School
Tokyo, Japan

Endocrinology
Memorial Sloan Kettering Cancer Center
New York, NY

Head & Neck Surgery
Mount Sinai
New York, NY

Medical Oncology
Massachusetts General Hospital
Boston, MA

Medical Oncology
University of Michigan
Ann Arbor, MI

Head & Neck Surgery
MD Anderson
Houston, TX
The Creators of TIRO Practice All Over the World

- Alberta, Canada
- Monterrey, Mexico
- Boston, MA
- New York, NY
- Los Angeles, CA
- San Francisco, CA
- Ann Arbor, MI
- Rochester, MN
- Philadelphia, PA
- Houston, TX
- Seattle, WA
- Buenos Aires, Argentina
- Brisbane, Australia
- Sydney, Australia
- Tokyo, Japan
- Paris, France
- Tel Aviv, Israel
- London, UK
How to Use TIRO
The Clinical Outline
You can access the Clinical Outline within any of the care recommendations. You can see other areas of interest on the page from within the Clinical Outline.
To view the Clinical Outline:
- click on the tab labeled “i” on the left hand side of any care recommendation page, or
- type the letter “i” if you are on a desktop or laptop computer.
The Clinical Outline consists of 3 parts.
Page Contents
This is a table of contents for the section. Here we show a high-level structure of the page, including 1st, 2nd and 3rd level headings.
As mentioned above, you can click anywhere in the clinical outline to move through the current page.
Educational Contents
This section shows at-a-glance any new, clinically relevant content that may have been discussed or uncovered during any of our weekly seminars. New content will be added dynamically, in the form of video clips. Summaries in text will later be written up to facilitate devices with lower bandwidth that might have difficulty streaming video.
Areas of Discordance
When we first began developing TIRO, it was immediately clear that certain guidelines differ on a given topic. We resolved to handle this by identifying those differences and giving context to them. This section shows—in brief—the summarized areas of discordance within the text, shown in red. In addition to exposing the differences in the content, we have asked experts in the field to offer their commentary—to shed light on the reasons for any discordance.
Tables & Figures
We created a centralized hub for our tables and figures. You may use these for reference purposes or in educational presentations. We registered many of our resources with Creative Commons. This means that you may use certain figures or tables in a presentation or publication. If you do, simply cite the following text in your sources or footnotes.
Copyright © TIRO, THANC Foundation. All rights reserved. Available at: https://tiro.expert

